Summary
Since Barack Obama first took office:
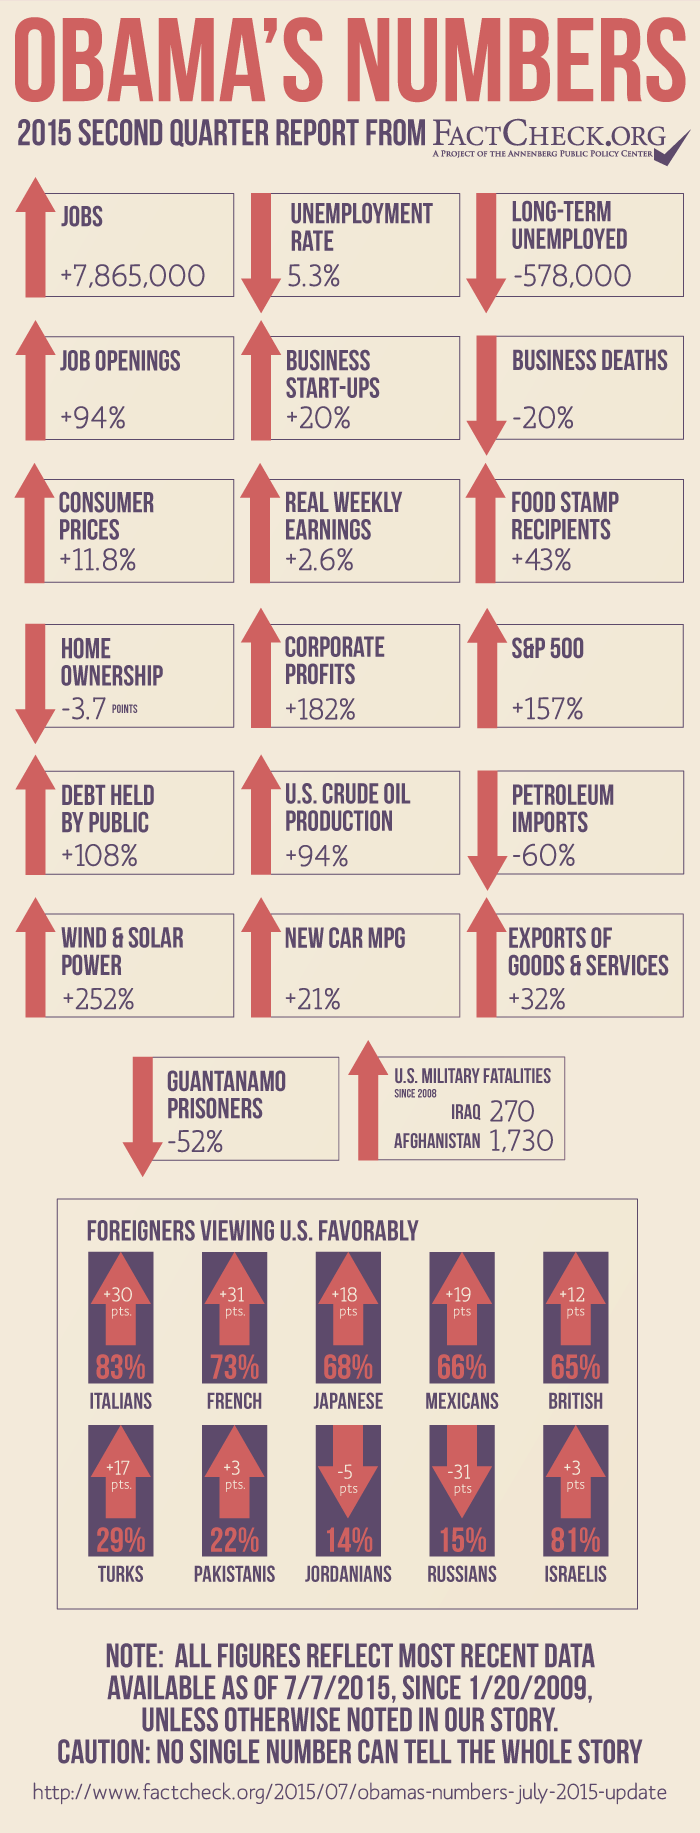
- The economy has added nearly 7.9 million jobs, and the unemployment rate is now lower than the historical median.
- Business establishment start-ups have increased by 20 percent, and the number of job openings is the highest in more than 14 years.
- The purchasing power of weekly paychecks is up 2.6 percent, despite some recent slippage.
- Nevertheless, the number of people receiving food stamps is still 43 percent higher than when Obama was first sworn in, despite recent declines.
- And the home ownership rate has continued to decline, to the lowest point in over a quarter century.
- U.S. oil production is up 94 percent. Wind and solar power are up 252 percent. U.S. dependency on oil imports is down to the lowest point since the 1970s.
- The percentage of foreigners who say they approve of the U.S. is up in most countries including France, Britain, Japan, Mexico, Turkey, Pakistan and even Israel, where it stands at 81 percent of those polled this year. One of the few exceptions is Russia, where U.S. favorability has plunged to 15 percent.
Analysis
As we do every three months, we offer here a fresh update of selected statistical indicators of what has happened since Barack Obama first took the oath of office in January 2009. Some are positive and some are not, but all are from sources we consider solid and reliable. And as usual, we caution that no single number or collection of numbers can tell the entire story.
Jobs & Unemployment
Number of Jobs — The jobs figure for June stands 659,000 higher than we reported three months ago. The economy has now added 7,865,000 jobs since Obama first took office.
Unemployment Rate — Meanwhile the unemployment rate continued to move downward, to 5.3 percent. It’s now 2.5 percentage points lower than it was in January 2009, when the president first took office in the midst of the worst economic downturn since the Great Depression.
Historically, the jobless rate is now better than it has been most of the time since 1948. The historical median is 5.6 percent.
Long-term Unemployment — February also saw the number of long-term unemployed — those who have been looking for work for 27 weeks or longer — drop further. The number went down to just over 2.5 million in June, which is 578,000 fewer than when the president first took office.
Job Openings — The number of job openings increased further since our last report, to 5,363,000 as of the last business day in May. That’s the highest number of openings since the Bureau of Labor Statistics began tracking them in December 2000. The number of openings has gone up 94 percent since the month the president entered office.
Business Start-ups — New business establishments are opening at an accelerating pace. The Bureau of Labor Statistics counted 224,000 “births” of new establishments in the three months ending last September, the most recent period on record. That’s an increase of just under 20 percent compared with the quarter prior to Obama’s first inauguration.
Meanwhile the number of business establishments shutting down permanently — business “deaths” — has gone down by just over 20 percent. The most recent figure is for the third quarter of 2013, because the BLS must wait a year before counting any shutdown as a permanent closing. Establishment birth and death figures are adjusted to compensate for seasonal variations.
Labor Participation Rate — Some effects of the 2007-2009 recession linger, however. The labor force participation rate, which is the portion of the civilian population that is either employed or currently looking for work, was 62.6 percent, down 3.1 percentage points since Obama took office.
But not all of that decline is due to the Great Recession and the slow recovery that followed. The rate actually peaked in early 2000, and it had declined by 1.6 percentage points before Obama took office.
A 2012 article by economists at the Federal Reserve Bank of Chicago concluded that just under half the decline “can be explained by long-running demographic patterns, such as the retirement of baby boomers.” The study predicted that these demographic patterns would continue, and would offset any improvements due to economic recovery in the future.
For more on this, see our March 11 item, “Declining Labor Force Participation Rates.”
Prices & Wages
Consumer Prices – Overall inflation in consumer prices has remained moderate over Obama’s first six years, rising by only 11.8 percent between January 2009 and May, the most recent month for which the Bureau of Labor Statistics has released the Consumer Price Index.
The average yearly rise under Obama of 1.9 percent is less than half the post-World War II average, according to BLS figures. Between 1946 and 2008 the average yearly rise in the CPI was 4 percent, measured from December to December. But the May CPI is 0.8 percentage points higher than it was at our last report, chiefly due to fuel prices rebounding from their recent lows.
Real Weekly Earnings – That recent jump took a bite out of the purchasing power of weekly paychecks; the gain in real weekly earnings that has occurred under Obama is now 0.4 percentage points lower than it was at our last report. Nevertheless, the BLS measure of average weekly earnings for all workers, adjusted for inflation and seasonal factors, is still 2.6 percent higher in May than it was when Obama first took office.
Gasoline – The national average price of regular gasoline has rebounded somewhat since the plunge that took it down to just over $2 a gallon in January. As of the week ended July 6, it stood at $2.79, according to the U.S. Energy Information Administration.
That’s 51 percent higher than the unusually low point at which it stood on Inauguration Day 2009, but still 24 percent lower than it had been one year earlier.
Food Stamps
The number of people receiving food stamps dropped by more than 600,000 since our last report. But as of March, the most recent month on record, more than 45.6 million Americans were still receiving the food aid, now known as the Supplemental Nutrition Assistance Program.
That’s only 4.5 percentage points lower than the record level set in December 2012, and nearly 43 percent higher than it was when Obama took office in 2009.
Nevertheless, Obama no longer qualifies for the title of “Food Stamp President” that Republican Newt Gingrich, the former speaker of the House, tried to hang on him during the 2012 presidential campaign. As we noted at the time, 14.7 million people were added to the food-stamp rolls during George W. Bush’s time in office. By comparison, the net gain under Obama now stands at 13.7 million — and it’s declining as the economy improves.
Home Ownership
The rate of home ownership has slipped once again since our last report, to its lowest point in more than 25 years.
As of the first quarter of this year, the percentage of U.S. housing that was owner-occupied was 63.8 percent (seasonally adjusted), according to the most recent release from the U.S. Census Bureau. That is the lowest rate since the fourth quarter of 1989.
The seasonally adjusted home ownership rate peaked at 69.4 percent in the second quarter of 2004, but it has declined 5.6 percentage points since then. Most of the decline — 3.7 percentage points — has taken place since Obama first took office.
Profits & Markets
Corporate Profits — Corporate profits have soared under Obama, smashing all previous records.
After-tax corporate profits are up since our last report. They hit a seasonally adjusted yearly rate of just under $1.9 trillion in the first three months of this year, according to the most recent figures from the U.S. Bureau of Economic Analysis. That nearly equals the record level set in the third quarter of 2014.
Profits are now running 182 percent higher than in the recession-plagued quarter just before Obama entered office. And they are 34 percent higher than in the best quarter prior to his taking office, which was the third quarter of 2006.
Stock Markets – Stockholders continue to do quite well under Obama. The Standard & Poor’s 500-stock index was 157 percent higher at the close on July 6 than it was the day Obama took office. Other stock indexes show similarly robust gains. The Dow Jones Industrial Average has more than doubled, rising 122 percent during Obama’s tenure, and the NASDAQ Composite index has tripled, rising 246 percent.
Federal Debt
The federal debt has gone down a bit since our last report — but that’s just a temporary effect of yearly tax payments flooding in around the April 15 deadline. The debt owed to the public still exceeds $13 trillion, an increase of just under 108 percent since Obama first took office. The debt also has gained dramatically even when measured as a percentage of the nation’s economic output, or gross domestic product.
The nonpartisan Congressional Budget Office estimates that the debt at the end of this fiscal year will amount to 74.2 percent of GDP, up from 52.3 percent at the end of fiscal 2009, which was the last budget year in which spending and revenue levels were mostly determined by Obama’s predecessor.
CBO projects that the FY 2015 deficit will come in at $486 billion, about the same as last year’s $485 billion deficit and about one-third of the $1.4 trillion deficit racked up in FY 2009.
But while CBO projects that deficits would decline slightly for the next few years under current taxing and spending policies, the annual shortfalls will resume their upward path fairly soon. In 2019, unless something is done, the debt will begin growing again as a percentage of the economy. By 2025 CBO estimates that the debt would amount to 77 percent of GDP, and interest payments would consume 13 percent of all federal spending (up from 6 percent this year).
Total debt, counting money the government owes to itself, currently stands at nearly $18.2 trillion, up 71 percent under Obama.
Energy
U.S. Crude Oil Production – The historic boom in U.S. crude oil production has continued to accelerate under Obama. In the second quarter of this year, the U.S. produced 94 percent more crude oil than it did in the three months before Obama began his presidency.
Oil Imports & Dependency — With domestic production surging, U.S. reliance on imported oil has been cut by more than half. Under Obama, as of the second quarter of 2015, net imports were down 60 percent.
And as a result, during the first five months of this year, the U.S. imported only 26.2 percent of the petroleum and refined products that it consumed. For all of 2014, the figure was 26.5 percent, the lowest annual level of dependency on imports since before the first Arab oil embargo of 1973-74.
To be sure, the U.S. oil boom is due mainly to advances in drilling technology rather than to any change in government policy. The decline in dependency on imports actually began in 2006, after peaking at 60.3 percent the year before. But the trend has continued and accelerated under Obama.
Wind & Solar – Electricity generated by wind and solar power in the most recent 12 months on record (ending in April) was 252 percent higher than the total for 2008.
The increase in solar power in particular has been spectacular. The U.S. generated nearly 25 times more electricity from solar power in the most recent 12 months than it did in the year before Obama took office.
These trends are partly due to large federal tax subsidies for wind and solar generation, all supported by Obama. But several states, independent of federal policy, also have imposed renewable energy standards that require electric utilities to generate a certain portion of their power from wind or solar. Market forces also have been at work: The cost of installing a solar system has dropped 73 percent since 2006, according to the Solar Energy Industries Association.
The U.S. produced 4.9 percent of all its electricity from wind and solar in the most recent 12 months on record, up from 1.4 percent in 2008. But coal still accounted for the biggest share — 37 percent — followed by natural gas at 29 percent and nuclear power at 20 percent.
Unfulfilled Promises
Exports – Exports have declined since our last report, leaving the president even further from fulfilling his 2010 promise to “double our exports over the next five years.” The clock ran out on that goal at the end of last year. And as of the first quarter of this year, according to the most recent report of the Bureau of Economic Analysis, U.S. exports of goods and services have gone up by only 32.4 percent since Obama took office.
Car Mileage — The fuel efficiency of new cars and light trucks shows practically no improvement since our last report. The average EPA city/highway sticker mileage of light duty vehicles sold was 25.4 miles per gallon. That’s actually 0.1 mpg lower than it was a year earlier, according to the University of Michigan’s Transportation Research Institute.
The June figure is 21 percent higher than it was when Obama first took office — but that’s a long way short of the president’s 2013 boast that “we have doubled the distance our cars will go on a gallon of gas.”
What Obama meant was that the administration was doubling the efficiency that it would call for in the future, putting in place requirements that cars and light trucks average 54.5 mpg by model year 2025. But recently, lowered gasoline prices have led car buyers to temper their enthusiasm for smaller, more efficient cars and trucks, stalling progress toward Obama’s goal. In fact, new-car mileage peaked at 25.8 mpg in August 2014, and has gone down 1.6 percent since then.
Guantanamo – Since our last report, six more prisoners have been released from the military detention camp for suspected terrorists in Guantanamo Bay, Cuba. But 116 remain at the facility, which Obama ordered to be closed within a year just after taking office. In the nearly six-and-a-half years since then, the population has been reduced by 52 percent.
War Deaths
Since our last report, three more U.S. military personnel have died in support of “Operation Inherent Resolve” against Islamic State forces in Iraq and elsewhere, bringing the total U.S. military fatalities in Iraq operations since Obama took office to 270. And four more have died supporting continuing U.S. operations in Afghanistan, bringing the total there to 1,730 since Obama became commander-in-chief.
World Opinion of U.S.
Senate Republicans criticize nearly every foreign policy decision Obama has made as president, and former Sen. Rick Santorum has gone so far as to claim, “The only two countries that we have a better relationship with now than when Barack Obama came into office are Cuba and Iran.”
But the fact is, with few exceptions, the U.S. is viewed more favorably overseas now than it was before Obama took office.
According to the most recent polling for the Pew Global Attitudes Project, 83 percent of Italians said they viewed the U.S. favorably in 2015, an increase of 30 percentage points over 2007, the last time Pew polled in Italy prior to Obama’s time in office.
In France, 73 percent viewed the U.S. favorably, up 31 points from 2008. In Japan, U.S. favorability was 68 percent, up 18 points. In Mexico, it was 66 percent, up 19 points. In Britain, it was 65 percent, an increase of 12 points.
The U.S. isn’t viewed so favorably in Turkey, where this year’s Pew poll showed a 29 percent favorable rating. But that was 17 points higher than in 2008. Pakistanis also hold a dim view of the U.S., giving it only a 22 percent favorable rating. But even that was 3 points higher than in 2008.
Among the few countries in which the U.S. favorable rating has slipped are Jordan, at 14 percent (down 5 points from 2008) and Lebanon, at 39 percent (down 12 points from 2008). Both border Syria, where Islamic State forces have seized substantial territory. And U.S. opposition to Russia’s actions against Ukraine isn’t popular among Russians; U.S. favorability there is down to 15 percent — a plunge of 31 points since 2008.
But in Israel — remarkably, in view of Obama’s very public disagreements with Prime Minister Benjamin Netanyahu over negotiations with Iran — 81 percent of those polled this year viewed the U.S. favorably, an increase of 3 points over 2007.
To be sure, popularity isn’t the same thing as power, and goodwill doesn’t always translate into influence. And approval of the U.S. doesn’t require approval of Obama: Only 49 percent of Israelis currently say they have confidence in Obama, for example.
But there’s little doubt that the U.S. is seen more favorably around the world under Obama than it was just before he took office.
— Brooks Jackson
Sources
Bureau of Labor Statistics. “Employment, Hours, and Earnings from the Current Employment Statistics survey (National); Total Nonfarm Employment, Seasonally Adjusted.” Data extracted 2 Jul 2015.
Bureau of Labor Statistics. “Labor Force Statistics from the Current Population Survey; Unemployment Rate, Seasonally Adjusted.” Data extracted Data extracted 2 Jul 2015.
Bureau of Labor Statistics. “Labor Force Statistics from the Current Population Survey; Number Unemployed for 27 Weeks & Over, Seasonally Adjusted.” Data extracted 2 Jul 2015.
Bureau of Labor Statistics. “Job Openings and Labor Turnover Survey: Job Openings, Seasonally Adjusted” Data extracted 7 Jul 2015.
Bureau of Labor Statistics. “Private sector establishment births and deaths, seasonally adjusted.” 29 Apr 2015.
Bureau of Labor Statistics. “Consumer Price Index – All Urban Consumers.” Data extracted Data extracted 2 Jul 2015.
Bureau of Labor Statistics. “Employment, Hours, and Earnings from the Current Employment Statistics survey (National); Average Weekly Earnings of All Employees, 1982-1984 Dollars.” Data extracted 2 Jul 2015.
U.S. Energy Information Administration. “Weekly U.S. Regular All Formulations Retail Gasoline Prices (Dollars per Gallon).” Data extracted 7 Jul 2015.
U.S. Department of Agriculture, Food and Nutrition Service. “Supplemental Nutrition Assistance Program (Data as of Dec 5, 2014).” Data extracted 2 Jul 2015.
U.S. Census Bureau. “Time Series: Seasonally Adjusted Home Ownership Rate.” Data extracted 2 Jul 2015.
Federal Reserve Bank of St Louis. “Corporate Profits After Tax (without IVA and CCAdj) (CP).” Data extracted 2 Jul 2015.
Google Finance. “S&P 500.” Historical prices. Data extracted 7 Jul 2015.
Google Finance. “Dow Jones Industrial Average.” Historical prices. Data extracted 7 Jul 2015.
Google Finance. “NASDAQ Composite.” Historical prices. Data extracted 7 Jul 2015.
U.S. Treasury. “The Debt to the Penny and Who Holds It.” 3 Jul 2015. Data extracted 7 Jul 2015.
Congressional Budget Office. “March 2015 Baseline” from “Updated Budget Projections: 2015 to 2025” 9 Mar 2015.
U.S. Energy Information Administration. “U.S. Crude Oil Production.” Short Term Energy Outlook. 7 Jul 2015. Data extracted 7 Jul 2015.
U.S. Energy Information Administration. “Table 3.3a. Monthly Energy Review.” 28 Jun 2015.
U.S. Energy Information Administration. Electric Power Monthly, “Table 1.1.A. Net Generation from Renewable Sources: Total (All Sectors), 2005-January 2015.” 25 Jun 2015.
U.S. Department of Commerce, Bureau of Economic Affairs. “Table 1. U.S. International Transactions: Exports of Goods and Services.” 18 Jun 2015.
Sivak, Michael and Brandon Schoettle. “Average sales-weighted fuel-economy rating (window sticker) of purchased new vehicles for October 2007 through March 2015.” University of Michigan Transportation Research Institute. 2 Jul 2015
New York Times. The Guantanamo Docket. “A History of the Detainee Population.” 13 Jun 2015.
iCasualties.org. “Operation Enduring Freedom/Afghanistan; Afghanistan Coalition Military Fatalities by Year.” Data extracted 7 Jul 2015.
iCasualties.org. “Operation Iraqi Freedom; Iraq Coalition Military Fatalities by Year.” Data extracted 7 Jul 2015.