Editor’s Note: This update is the first to reflect substantial economic effects of the COVID-19 pandemic. Many statistics in our April update were collected before much of the economy was shut down to slow the spread of the virus.
Summary
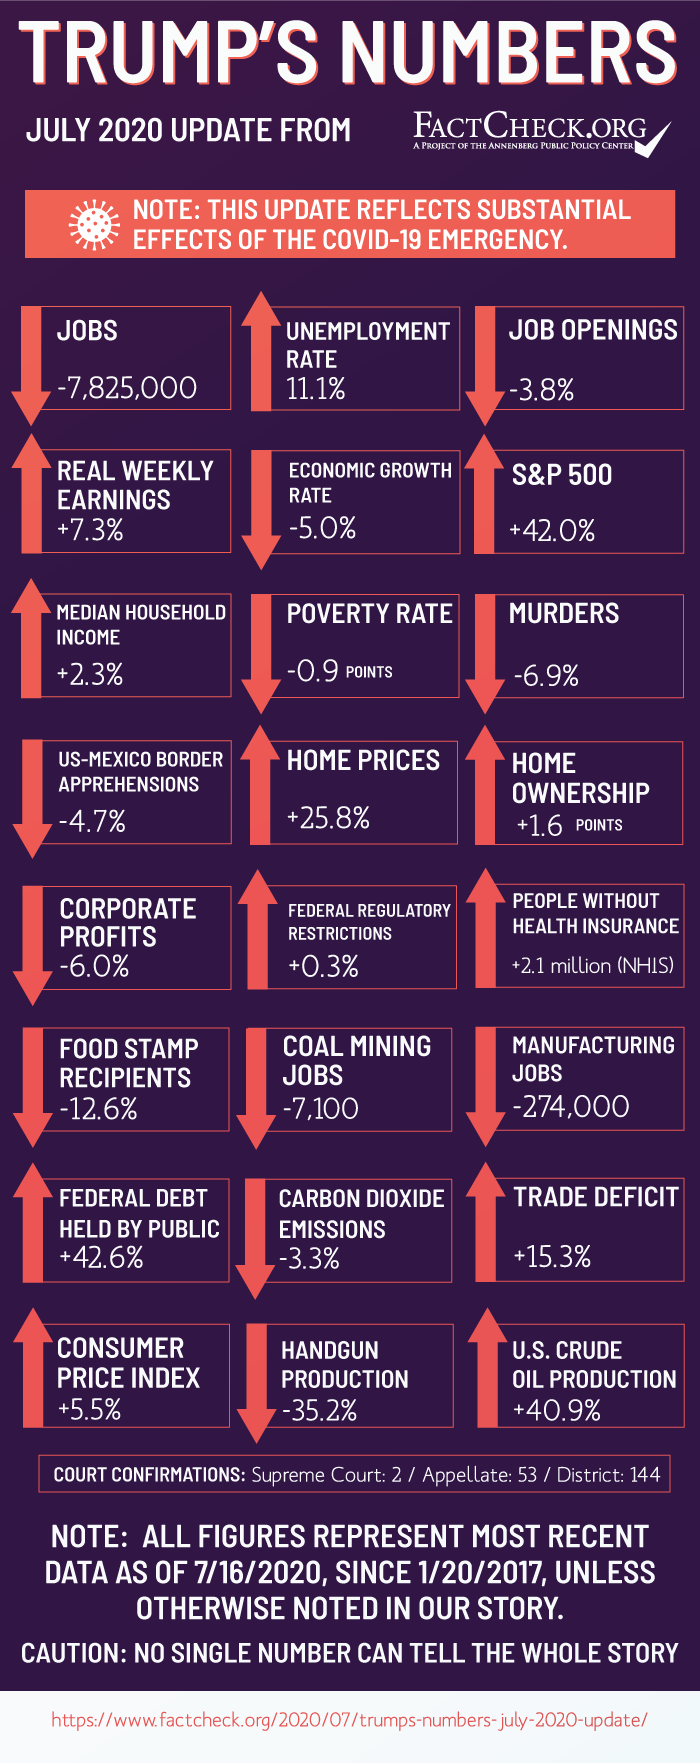
The COVID-19 emergency and the sudden economic recession it triggered have greatly altered many statistical measures of the Trump years. Since he took office:
- 7.8 million jobs have been lost — including 7,100 coal mining jobs and 274,000 manufacturing jobs.
- The unemployment rate soared to the highest levels since World War II, and stood at 11.1% most recently.
- The economy — which had been growing modestly — shrank at an annual rate of 5% in the first quarter and much worse is predicted in the quarter just ended.
- Stock prices dropped sharply in response to COVID-19, but they have since mostly recovered. The NASDAQ index even set some new records.
- Corporate profits sagged, recently running 6% lower (even after taxes) than before Trump took office.
- But inflation remained low, and real weekly wages (for those who still have jobs) are up 7.3%.
Analysis
This is our 10th quarterly update of the “Trump’s Numbers” scorecard that we posted in January 2018 and have updated every three months, most recently on April 13. We’ll publish additional updates every three months, as fresh statistics become available.
Here we’ve included statistics that may seem good or bad or just neutral, depending on the reader’s point of view. That’s the way we did it when we posted our first “Obama’s Numbers” article more than seven years ago — and in the quarterly updates and final summary that followed. And we’ve maintained the same practice under Trump.
Then as now, we make no judgment as to how much credit or blame any president deserves for things that happen during his time in office. Opinions differ on that.
Jobs and Unemployment
Job growth slowed a bit under Trump — then collapsed as the COVID-19 crisis led to mass unemployment.
Employment — After nine years and five months of constant monthly job gains — the longest such streak on record — more than 22 million jobs disappeared between mid-February and mid-April.
At the low point in April nearly all the job gains of the previous 10 years were gone. In May and June a little over one-third of those jobs were regained as states eased COVID-19 restrictions and many businesses were allowed to reopen.
Nevertheless, as of mid-June, the most recent month on record, total employment stood more than 7.8 million below where it was when Trump took office in January 2017.
Even in February, when employment was at its highest, Trump was far behind the pace needed to fulfill his campaign boast that he would be “the greatest jobs president that God ever created.” Up until then, the average monthly gain under Trump had been 185,000, while the average monthly gain during the four years before he took office was 216,000.
Unemployment — The unemployment rate, after falling at times to the lowest rate in half a century, hit a high of 14.7% in April, by far the highest since the Bureau of Labor Statistics began tracking the figure in 1948.
As portions of the economy have reopened, the number of jobs has slowly begun to recover, and the jobless rate has turned down. But as of mid-June, the rate was 11.1% — still higher than any month since 1948 except for April and May.
Before the COVID-19 plunge, the jobless rate in February and several earlier months had been 3.5%, the lowest since December 1969 — 50 years earlier — when it was also 3.5%.
Job Openings — The COVID-19 shock ended what had been a worker shortage.
As of the last business day of May, the most recent figure on record, the number of unfilled job openings stood at 5.9 million. At that point the number had declined by 210,000 — or 3.8% — since Trump took office.
The number of unfilled jobs had been as high as 7.5 million as recently as January 2019, which was the highest in the 20 years the BLS has tracked this figure. And for 23 consecutive months, starting in March 2018, the number of available jobs exceeded the number of unemployed people looking for work.
But that all came to an end soon after the White House declared a COVID-19 emergency. By the end of May, there were 17.8 million more job-seekers than job openings.
Labor Force Participation — The labor force participation rate — which went down 2.9 percentage points during the Obama years — dropped another 1.3 points under Trump.
The labor force participation rate is the portion of the entire civilian population age 16 and older that is either employed or currently looking for work in the last four weeks. Republicans often criticized President Barack Obama for the decline during his time, even though it was due mostly to the post-World War II baby boomers reaching retirement age, and other demographic factors beyond the control of any president.
The rate stood at 62.8% when Trump took office, and in February that rate had climbed to 63.4%, a gain of 0.6 percentage points. But all that was lost as the COVID-19 emergency caused many to simply leave the workforce entirely. By June the rate had bounced back a bit, but still stood only at 61.5%.
Manufacturing Jobs — Manufacturing jobs — which had increased under Trump — took a deep dive as the virus crisis forced a wave of plant closings.
Nearly 1.4 million manufacturing jobs were lost in March and April. A little over 600,000 of those had been regained by mid-June.
But the net result is that as of the latest report, 274,000 fewer people were employed in manufacturing than when Trump took office. That followed a net decrease of 192,000 under Obama.
Economic Growth
Even before the COVID-19 pandemic sent the economy into its current deep recession, the U.S. economy had been growing more slowly than Trump once promised.
Real (inflation-adjusted) gross domestic product grew 2.3% last year and 2.9% the year before — better than the 1.6% growth in 2016 but far less than the 4% to 6% per year that Trump promised repeatedly, both when he was a candidate and also as president. Growth in Trump’s best year was no better than growth in Obama’s best year, 2015.
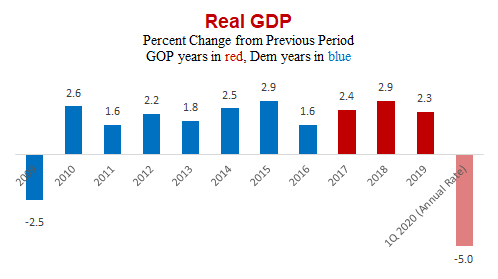
That growth halted in February, and the economy entered a sudden, steep recession, according to the Business Cycle Dating Committee of the National Bureau of Economic Research — made up of economists from leading universities. In the first quarter of 2020 the economy shrank at an annual rate of 5%, according to the U.S. Commerce Department’s Bureau of Economic Analysis.
The worst is yet to come. The Congressional Budget Office on May 19 forecast an absolute decline of 11% in second-quarter (April-June) real GDP — equivalent to an annual-rate decline of 38%. That would be by far the worst quarter since 1947, when the government began quarterly tracking of real GDP. The worst previously was the January-March quarter of 1958, when real GDP went down at a yearly rate of 10%.
The economy is expected to rebound to some degree as states ease COVID-19 restrictions — but slowly.
The most recent forecast of the Federal Reserve Board members and Federal Reserve Bank presidents, issued June 10, produced a median estimate of a 6.5% drop in real GDP for all of 2020 (measured from fourth quarter to fourth quarter, rather than from year to year).
CBO is only slightly less pessimistic. It issued an updated forecast July 2 projecting a 5.9% decline in GDP this year measured quarter to quarter (or 5.8% measured year to year). CBO said it now expects growth in the last half of this year will be even slower than it expected in May.
Income and Poverty
Household Income — Before the COVID-19 crisis, household income rose briskly during the Trump administration.
The Census Bureau’s measure of median household income reached $63,179 in 2018, an increase of $1,400 from 2016 after adjusting for inflation.
In percentage terms, the increase during Trump’s first two years is 2.3%. (The median figure represents the midpoint — half of all households earned more, half less.)
The official figure is the highest ever recorded, exceeding previous records set in 2016 and 2017. But Census officials said those recent “records” are all due in part to a change in the survey questions in 2014. Starting then, the annual survey has picked up some sources of income that were previously missed.
Adjusting for that factor, and also for a change in the way Census processed data starting last year, Census officials published “estimated adjusted” figures showing what median household income would have been for past years, had the current questionnaire and processing procedures been in place. On that basis, the latest figure is just a few dollars less than it was in 1999 — $63,231.
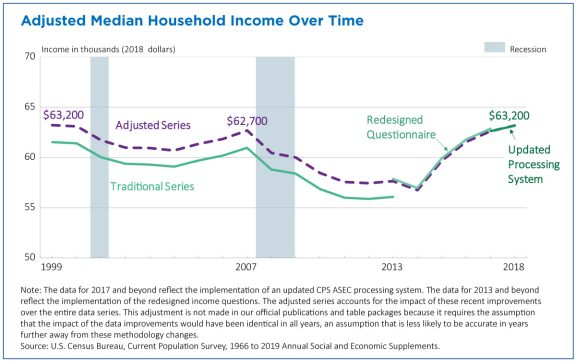
The “estimated adjusted” figures also show an even greater increase during Trump’s first two years than the official figures, because the new data processing procedures had the effect of holding down income by a fraction of a percentage point. On an adjusted basis, the increase under Trump would be $1,638, or 2.7%.
Poverty — As incomes rose, the rate of poverty declined. The percentage of Americans living with income below the official poverty line went down to 11.8% of the population in 2018, the lowest level since 2001.
The poverty rate has now declined for four consecutive years, dropping by 1.3 percentage points in 2015, by 0.8 points in 2016 and by 0.4 points and 0.5 points in Trump’s first two years.
Regulations
The growth of federal regulation has nearly stopped under Trump.
The number of restrictive words and phrases (such as “shall,” “prohibited” or “may not”) contained in the Code of Federal Regulations stayed below 1.08 million for most of last year — a little below where it was when Trump took office. As of July 10, the count had crept up to a little above 1.08 million — an increase of 3,624 (or 0.3%) since Trump’s inauguration.
That the number has barely changed is a big departure from the past, when restrictions grew at an average of 1.5% per year during both the Obama years and the George W. Bush years, according to annual figures from the QuantGov tracking project at George Mason University’s Mercatus Center.
The Mercatus count of restrictions doesn’t attempt to assess the cost or benefit of any particular rule — such assessments require a degree of guesswork and are sensitive to assumptions. But it does track the sheer volume of federal rules with more precision than we have found in other metrics.
Some of the recent changes are just clearing deadwood. In 2018, for example, the Treasury Department scrapped an entire chapter of zombie-like regulations issued by the old Office of Thrift Supervision, which oversaw the savings and loan industry before being abolished in 2011. S&Ls have since fallen under other federal banking regulators, but the obsolete OTS rules remained on the books.
However, many of the rules Trump has eliminated are quite significant. For example, in what it called “the largest deregulatory initiative of this administration,” the Trump administration issued a final rule that nullifies Obama-era fuel economy standards for new cars and light trucks. The administration said that instead of commanding automakers to achieve average mileage of 46.7 miles per gallon by model year 2025, the Trump rule will require them to achieve only an average of 40.4 mpg.
Another example: Last September, the EPA’s Affordable Clean Energy rule took effect, repealing the Obama administration’s Clean Power Plan rule. The Obama-era rule was designed to reduce carbon dioxide emissions by shifting away from coal as an energy source and would have required states to meet specific emissions reductions.
Crime
Crime declined since Trump took office.
The FBI’s annual Crime in the United States report, released Sept. 30, showed the number of murders declined 6.9% during Trump’s first two years in office.
And the decline continued into the first half of last year, according to the FBI’s preliminary semiannual report released Jan. 21. The FBI tallied 3.9% fewer murders during the first half of 2019 than in the same period in 2018.
The murder rate per 100,000 people went down to 5.0 in 2018, still well above the record low set in 2014, when it was 4.4. The FBI doesn’t calculate rates in its semiannual reports, so the rate for 2019 won’t be known until full-year figures are released, which usually happens in September.
As a candidate, Trump repeatedly claimed that the murder rate was the “highest it’s been in 45 years.” That was far from true. The rate did rise during Obama’s final two years, to 5.4 per 100,000 in 2016. But the highest rate in the past half century was 10.2 in 1980.
The number of violent crimes (murder, rape, robbery and aggravated assault) went down 3.5% between 2016 and 2018, and dropped another 3.1% in the first six months of 2019, compared with the same period a year earlier.
The number of property crimes (burglary, larceny and motor vehicle theft) went down 9.2% during Trump’s first two years, and declined another 5.6% in the first half of last year, compared to the same six months a year earlier.
Guns
Sales and production of guns pulled back after Trump became president, but are lately surging again.
Handgun Production — In 2019, annual production of pistols and revolvers in the U.S. totaled 3.6 million, according to interim figures from the Bureau of Alcohol, Tobacco, Firearms and Explosives.
That represented a decline of 35.2% from 2016, when production surged to a record level of nearly 5.6 million.
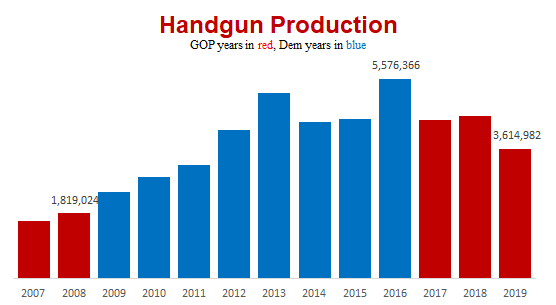
Handgun production more than tripled during the Obama years. So the 2018 level was still 99% higher than it had been in 2008, the last year of George W. Bush’s presidency.
Gun Sales — Gun sales also dropped a little — until COVID-19 concerns and June street protests set off new waves of buying this year.
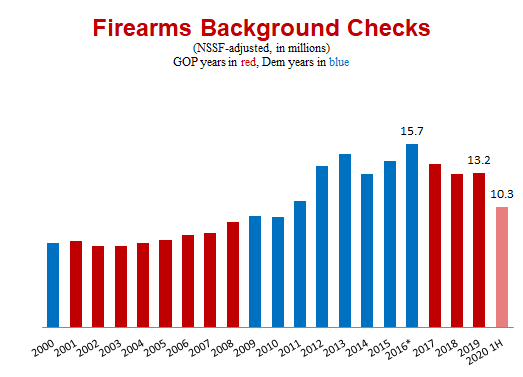
The government doesn’t collect figures on sales of guns. But the National Shooting Sports Foundation — the gun industry’s trade group — tracks approximate sales figures by adjusting FBI statistics on background checks to remove those not related to actual sales, such as checks required for concealed-carry permits.
Those NSSF-adjusted figures dropped from a record 15.7 million in Obama’s final year to 13.2 million last year.
But the COVID-19 pandemic forced millions of layoffs and sent many flocking to gun stores. March alone saw an 80% increase over the same month in 2019. An even bigger wave of buying took place in June, as protests over police brutality and racial injustice occurred across the country, some of them turning violent. June’s NSSF-adjusted figures were 136% above the same month last year.
During the most recent 12 months on record, the NSSF-adjusted figure for background checks was 9.9% higher than the record year of 2016.
These figures cover rifles and shotguns and previously owned weapons, as well as new handguns. They are only an approximation of actual sales, since some of these checks cover purchases of multiple weapons, and of course some sales still occur without background checks.
Coal and Environment
Coal Mining Jobs — As a candidate, Trump promised to “put our [coal] miners back to work,” but he hasn’t.
As of June, there were 7,100 fewer coal mining jobs than when Trump took office, according to BLS figures. That’s a decline of nearly 14%.
The coronavirus pandemic may have hastened some of the losses, but, in fact, nearly 600 mining jobs were lost as early as September — long before the virus appeared in China — when two Wyoming mines closed and the owner filed for bankruptcy protection. And Moody’s Investor Services said it had been predicting a 15% to 20% decline in U.S. coal production this year even before the virus hit.
U.S. coal production last year was the lowest in 41 years — and it’s headed much lower this year. During the 12 months ending in May (the most recent month for which figures are available), the Energy Information Administration estimated that 627 million short tons were produced, which is 14% below the figure for 2016.
The outlook for coal miners has gotten even more bleak since our last report. In July, EIA predicted that coal production would fall 29% in 2020, in part due to lower demand for coal-generated electricity during a virus-induced world economic slump.
Carbon Emissions — Carbon dioxide emissions from energy consumption declined under Trump, continuing a long downward trend that started years before he took office.
Figures from EIA show CO2 emissions were nearly 3.3% lower in the most recent 12 months on record, ending in March, than they were in 2016.
In the decade before Trump took office, emissions fell by a total of 14%, due mainly to electric utilities shifting away from coal-fired plants in favor of cheaper, cleaner natural gas, as well as solar and wind power.
EIA is currently estimating that CO2 emissions will fall by a record 12.2% in 2020 as a result of the slowing economy and restrictions on business and travel related to COVID-19.
Border Security
Illegal border crossings have subsided after surging last year to the highest in a dozen years. But they are still running only slightly lower than before Trump took office.
Last year, a monthly average of 66,640 people were apprehended attempting to illegally enter the U.S. at the border with Mexico, the highest level since 2007.
The peak month was May, which saw 132,856 apprehensions, according to U.S. Customs and Border Protection statistics. That was the highest total since March 2006, when the monthly total hit nearly 161,000.
During the first six months of 2020, the average has gone down to 26,227 per month.
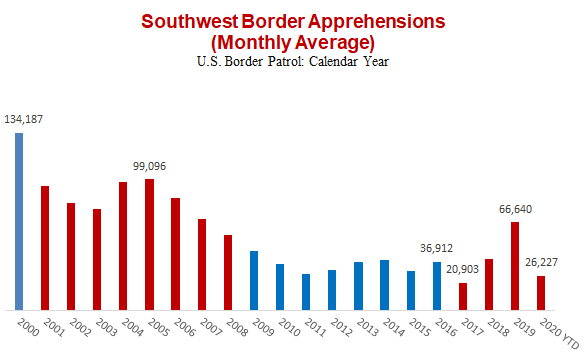
Attempted border crossings tend to be highest in March, April and May and lowest in December. So to even out that seasonal factor, our measure compares the most recent 12 months on record with the year prior to a president taking office. And for the past 12 months, apprehensions totaled 422,316, just 4.7% below 2016, when the total was 442,940.
Corporate Profits
After-tax corporate profits remained near record levels during Trump’s presidency — until taking a battering during this year’s pandemic.
During 2019, they hit $1.85 trillion for the year (see line 45), just under the record $1.86 trillion recorded for 2014. But in the first quarter of this year they sank to an annual rate of $1.64 trillion, with worse likely to come.
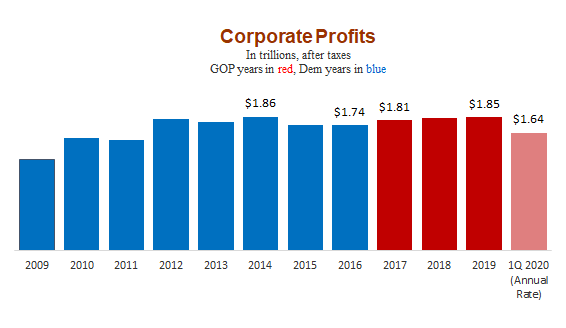
The most recent quarterly figure is 6% lower than the full-year figure for 2016, the year before Trump’s inauguration.
Stock Market
The stock market topped a decade-long bull market with new records in early 2020 — until the bottom dropped out in March as the COVID-19 emergency forced businesses to close and lay off millions of workers.
At one point roughly all the gains of the Trump years were erased. But over subsequent weeks stock prices mostly recovered, and the tech-heavy NASDAQ index even set some new records.
The Standard & Poor’s 500-stock average closed most recently on July 16 at 42.0% above where it had been the day before Trump was inaugurated.
Other indexes also reflected investor optimism. At the July 16 close, the Dow Jones Industrial Average, made up of 30 large corporations, was up 35.5% during Trump’s time in office.
And the NASDAQ composite index, made up of more than 3,000 companies, was up 89.1% under Trump.
Wages and Inflation
The upward trend in real wages continued under Trump, and inflation remained in check.
CPI — The Consumer Price Index rose 5.5% during Trump’s first 41 months, continuing a long period of historically low inflation.
In the most recent 12 months, ending in March, the CPI rose only 0.7% — held down by a plunge in gasoline prices and the pandemic-triggered economic recession. The CPI rose an average of 1.8% each year of the Obama presidency (measured as the 12-month change ending each January), and an average of 2.4% during each of the George W. Bush years.
Wages — Paychecks continued to grow faster than prices.
The average weekly earnings of all private-sector workers, in “real” (inflation-adjusted) terms, rose 7.3% during Trump’s first 41 months (ending in June).
Those figures include managers and supervisors. Rank-and-file production and nonsupervisory workers — at least, those who still have jobs — are doing even better than their bosses. Real earnings for those workers (81% of all workers) have gone up 8.7% so far under Trump.
Those gains extend a long trend. Real wages took a dive during the Great Recession of 2007-2009, but have been rising now since hitting a low point in July 2008. During the Obama years, real weekly earnings rose 4.1% for all workers, and 4.2% for rank-and-file.
Consumer Sentiment
Consumer confidence in the economy, which at first rose under Trump, took its worst plunge on record when the COVID-19 emergency hit.
The University of Michigan’s Surveys of Consumers monthly index first soared to a peak of 101.4 in March 2018, which was the highest in 14 years. It was still at 101.0 as recently as February.
But in March and April, it took the steepest decline ever recorded, to 71.8. That was the lowest since December 2011, when the nation was struggling to recover from the Great Recession of 2007-2009.
By June — the most recent month on record — the index had crept up to 78.1. But that was still 9.1 points lower than in October 2016, just before Trump was elected after promising to boost economic growth.
Home Prices and Ownership
Home Prices — Home prices soared to record levels during Trump’s tenure, and so far haven’t been affected by the pandemic.
The national median price of an existing, single-family home set a record high of $288,700 in April, according to sales figures from the National Association of Realtors. In May, the most recent figure on record, the median price slipped back only a bit, to $287,700.
That is $59,000 higher than the median price of $228,700 for homes sold during the month Trump took office — a gain in value of 25.8%. The rise in the Consumer Price Index during the same period was 4.9%.
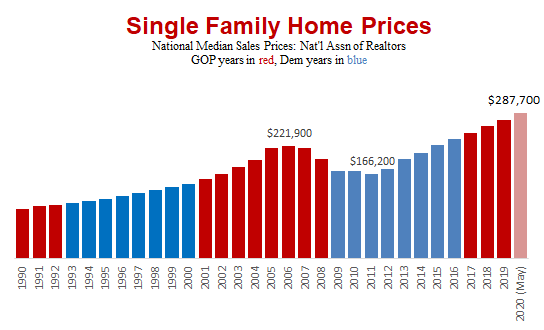
The Realtors’ figures reflect raw sales prices without attempting to adjust for such factors as variations in the size, location, age or condition of the homes sold in a given month or year. Even so, a similar pattern emerges from the S&P CoreLogic Case-Shiller U.S. National Home Price Index, which compares sales prices of similar homes and seeks to measure changes in the total value of all existing single-family housing stock.
The Case-Shiller index for April sales (the most recent available) was at a record high — and 17.9% above where it stood in the month Trump took office.
Whichever way you measure it, homeowners have seen the value of their houses rise to record levels since Trump became president.
Homeownership — The percentage of Americans who own their homes has continued to recover under Trump.
Back in 2004, the homeownership rate hit a record 69.2% of households for two quarters, but then began a years-long slide, hitting bottom in the second quarter of 2016 at 62.9%. That was the lowest point in more than half a century, and tied for the lowest on record.
The rate recovered 0.8 points in the six months before Trump took office, and has gone up another 1.6 points since then, reaching 65.3% in the first quarter of 2020, the most recent Census Bureau figure available.
But that’s still 3.9 points below the peak level of 16 years earlier.
Trade
(Note: These figures reflect an “annual revision” made by the Bureau of Economic Analysis on June 4, which changed historic trade figures going as far back as 1999, in some years by more than 2%.)
The trade deficit that Trump promised to reduce grew larger instead, but now is headed down.
The most recent government figures show that the total U.S. trade deficit in goods and services during the most recent 12 months on record (ending in May) was nearly $555 billion, an increase of 15.3% over the deficit for 2016.
The deficit seemed to stabilize in 2019, falling 0.5% compared with the previous year, after rising 11.4% in 2018 and 6.3% in 2017, Trump’s first year in office.
The decline in the deficit has continued into 2020, falling 9.1% during the first five months of the year, compared with the same period a year earlier. That’s partly due to the new coronavirus that emerged in China in December, leading to massive disruption of China’s production and a big drop in U.S. imports of Chinese goods.
China — The goods-and-services trade deficit with China has finally grown smaller under Trump.
Trump began a full-scale trade conflict with China in early 2018. At first the trade gap with China continued to go up, but that turned around in 2019, when the US-China trade gap went down 19% compared with the previous year. During the most recent 12 months on record (ending in March), the gap was 10.9% lower than the year before Trump took office, according to BEA’s newly revised figures.
The trade war continues. Trump signed a “phase one” trade deal with China on Jan. 15, under which the U.S. held off on new tariffs while China promised to buy more U.S. agricultural goods. But by June China was reported to be going back on that deal. China also has yet to agree to reduce subsidies to exporting businesses or to limit its demands that U.S. businesses share their intellectual property.
Mexico — Meanwhile the much smaller trade deficit in goods and services with Mexico has grown much faster than the global trade gap. It totaled $108 billion during the most recent 12 months, an increase of 68% compared with 2016.
Canada — The trade surplus that the U.S. runs with Canada has turned into a deficit. In 2016, the U.S. sold nearly $10.9 billion more to Canada in goods and services than Canada bought from the U.S. That flipped last year, when the U.S. imported $2.7 billion more from Canada than the other way around. For the most recent 12 months on record the gap widened to $6.5 billion.
On March 13, Canada gave final legislative approval of a new trade agreement with the U.S. and Mexico, to replace the 26-year-old North American Free Trade Agreement, which Trump had promised to scrap during his campaign. The agreement finally took full effect July 1.
Health Insurance Coverage
The number of people who have no health insurance rose by at least 2 million under Trump.
The most recent figures come from the National Health Interview Survey, which on May 28 put the number of people who lacked coverage in the first six months of 2019 at 30.7 million — an increase of 2.1 million since 2016, the year before Trump took office.
The latest NHIS figures are still preliminary and subject to final data editing and final weighting. The 2019 figures also are the first produced using a questionnaire that was redesigned to improve measurement and reduce the burden on respondents, so may not be strictly comparable to figures from prior years.
The most recent NHIS survey is, however, in general agreement with figures reported by the Census Bureau last year, which showed an increase in the number of uninsured of 1.9 million between 2018 and 2017 — the first time in a decade that this number increased.
Census used a new “improved” method to estimate the uninsured population in 2017 and 2018, and said these figures shouldn’t be compared with estimates produced in 2016 and earlier years.
A much greater rise was reported by a Gallup survey covering the final quarter of 2018. Gallup, on Jan. 23, 2019, put the rise in uninsured adults at about 7 million, compared with the last half of 2016. For details, see our Feb. 12 story, “Did the Uninsured Increase by 7 Million?“
Trump failed to “repeal and replace” the Affordable Care Act as he promised to do, but did slash advertising and outreach aimed at enrolling people in Obamacare plans. In December 2017, he signed a tax bill that ended the ACA’s tax penalty for people who fail to obtain coverage, effective last year. In March 2019, the Trump administration joined an effort by GOP state attorneys general seeking a court decision to overturn the entire act. And on June 25 the administration formally asked the Supreme Court to strike down Obamacare.
Food Stamps
The number of food stamp recipients dropped to the lowest levels in a decade — but is rising again since the COVID-19 recession hit.
Early last year, the number dropped below 38 million for the first time since October 2009, when millions were signing up for benefits in the aftermath of the Great Recession of 2007-2009.
The decline continued until February, when the number dipped just below 36.9 million before turning upward as millions lost their jobs. In March, the number of people receiving food stamps rose by nearly 480,000.
As of that month, the most recent on record, the number of food stamp recipients was 37.3 million — or 12.6% below where it stood when Trump took office.
Before millions were thrown out of work in the COVID-19 recession, the administration was working to reduce the number further. For example, it finalized a new rule tightening work requirements for able-bodied adults without dependents, estimated to make 688,000 fewer people eligible for benefits in the fiscal year that begins Oct. 1, according to the Department of Agriculture’s regulatory analysis.
But now it has reversed course. On March 18 the president signed a bipartisan emergency relief bill that (among other things) both suspended the new work requirement rule temporarily and also made families eligible for food stamps if their children had received free or reduced cost meals at schools that are now closed.
Currently the administration is giving states fistfuls of waivers, loosening rules to make it easier to obtain and use food stamps. It is also rolling out a pilot program — in 40 states so far — that allows use of food stamps to make online grocery purchases at Walmart, Amazon and a few others.
Judiciary Appointments
Trump is putting his mark on the federal appeals courts more quickly than Obama was able to do in his time in office.
Supreme Court — So far, Trump has won Senate confirmation for two Supreme Court nominees, Justice Neil M. Gorsuch and Justice Brett M. Kavanaugh.
Obama also was able to fill two high court vacancies during his first two years in office, with Justice Sonia Sotomayor and Justice Elena Kagan.
Court of Appeals — Trump also won confirmation of 53 U.S. Court of Appeals judges (30 during his first two years and another 23 in 2019 and so far in 2020). That’s far more than the total for Obama, who won confirmation for 30 as of the same point in his first term (16 during his first two years and 14 more in 2011 and through this date in 2012).
Trump has now installed nearly 30% of all the 179 appellate court judges authorized by federal law.
District Court — Trump also outpaced Obama on filling lower courts, though by a smaller margin. So far, Trump has won confirmation for 144 of his nominees to be federal District Court judges. That’s over 21% of the 677 authorized district judges. Obama had won confirmation for 125 at the same point in his presidency.
Trump also has filled five seats on the U.S. Court of Federal Claims, which has nationwide jurisdiction over lawsuits seeking money from the government. And he has filled two seats on the U.S. Court for International Trade. Obama filled none to either court during his first term.
Trump must share responsibility for this record with the Republican majority in the Senate. Republicans not only refused to consider Obama’s appointment of Merrick Garland to fill the Supreme Court vacancy eventually filled by Gorsuch, but they also blocked confirmation of dozens of Obama’s nominees to lower courts. Trump inherited 17 Court of Appeals vacancies, for example, including seven that had Obama nominees pending but never confirmed.
Federal Debt and Deficits
The federal debt has increased by over $6.1 trillion under Trump. And the rise is continuing as the government borrows frantically to fund emergency COVID-19 spending.
The federal debt held by the public stood at over $20.5 trillion at the last count on July 14 — 42.6% higher than on the day he took office.
The figure is certain to rise as tax revenues fall due to the partial shutdown of the economy, and spending ramps up to aid jobless workers and shuttered businesses.
But even before the COVID-19 emergency, Trump’s cuts in corporate and individual income tax rates — as well as bipartisan spending deals he signed in 2018 and 2019 — caused the red ink to gush faster than it did before.
The federal government’s annual deficit hit $984 billion in fiscal year 2019, which ended Sept. 30 last year. And the deficit has soared to $2.7 trillion during the first nine months of the current fiscal year.
The debt at the end of 2019 was equal to about 79% of the nation’s entire gross domestic product. But with the economy shrinking and the debt soaring, the bipartisan Committee for a Responsible Budget estimated on July 2 (working from CBO data) that the debt will exceed the size of the economy this year, and swell to 121% of total economic output by 2030.
Oil Production and Imports
U.S. crude oil production resumed its upward trend under Trump, hitting record levels. Production topped 4 billion barrels in 2018 for the first time on record, and kept on rising. In the 12 months ending in April (the most recent data available), it reached nearly 4.6 billion barrels. That was 40.9% higher than in all of 2016.
With production surging, the nation’s dependence on imported petroleum at last disappeared.
Dependence on foreign oil peaked in 2005, when the U.S. imported 60.3% of its petroleum. But the U.S. became a net exporter last September, and in nearly every month since, according to Energy Information Administration figures. During the first five months of 2020, the U.S. produced enough oil to supply all its domestic needs and exported another 4.6% in surplus oil and petroleum products, EIA estimated.
Editor’s note: FactCheck.org does not accept advertising. We rely on grants and individual donations from people like you. Please consider a donation. Credit card donations may be made through our “Donate” page. If you prefer to give by check, send to: FactCheck.org, Annenberg Public Policy Center, 202 S. 36th St., Philadelphia, PA 19104.
Sources
Bureau of Labor Statistics. “Employment, Hours, and Earnings from the Current Employment Statistics survey (National); Total Nonfarm Employment, Seasonally Adjusted.” Data extracted 16 Jul 2020.
Bureau of Labor Statistics. “Labor Force Statistics from the Current Population Survey; Unemployment Rate, Seasonally Adjusted.” Data extracted 16 Jul 2020.
Bureau of Labor Statistics. “Job Openings and Labor Turnover Survey: Job Openings, Seasonally Adjusted.” Data extracted 16 Jul 2020.
Bureau of Labor Statistics. “Labor Force Statistics from the Current Population Survey; Labor Force Participation Rate.” Data extracted 16 Jul 2020.
Bureau of Labor Statistics. “Labor Force Statistics from the Current Population Survey; Unemployment Level, Seasonally Adjusted.” Data extracted 16 Jul 2020.
Bureau of Labor Statistics. “Labor Force Statistics from the Current Population Survey; All employees, thousands, manufacturing, seasonally adjusted.” Data extracted 16 Jul 2020.
National Bureau of Economic Research. “Determination of the February 2020 Peak in US Economic Activity.” 8 Jun 2020.
U.S. Bureau of Economic Analysis. “Table 1.1.1. Percent Change From Preceding Period in Real Gross Domestic Product.” Interactive data extracted 16 Jul 2019.
U.S. Bureau of Economic Analysis. “Gross Domestic Product, First Quarter 2020 (Third Estimate) Corporate Profits, First Quarter 2020 (Revised Estimate). 25 Jun 2020.
U.S. Census Bureau. “Current Population Survey, 1966 to 2019 Annual Social and Economic Supplements.” 10 Sep 2019.
McLaughlin, Patrick A., and Oliver Sherouse. RegData U.S. Regulation Tracker. QuantGov, Mercatus Center at George Mason University, Arlington, VA. Downloaded 16 Jul 2020.
McLaughlin, Patrick A. and Oliver Sherouse. RegData US 3.1 Annual (dataset). QuantGov, Mercatus Center at George Mason University, Arlington, VA.. “RegData 3.1 Annual Summary.” Downloaded 16 Jul 2020.
Federal Bureau of Investigation. “Crime in the United States 2018,” Table 1. 30 Sep 2019.
Federal Bureau of Investigation. “Preliminary Semiannual Uniform Crime Report, January–June, 2019.” 21 Jan 2020.
U.S. Bureau of Alcohol, Tobacco, Firearms and Explosives. “Annual Firearms Manufacturing and Export Report, Year 2019 Interim.” 7 Jul 2020.
U.S. Bureau of Alcohol, Tobacco, Firearms and Explosives. “Annual Firearms Manufacturing and Export Report, Year 2016 Final.” 4 Jan 2018.
U.S. Bureau of Alcohol, Tobacco, Firearms and Explosives. “Annual Firearms Manufacturing and Export Report, Year 2008 Final.” 8 Mar 2011.
National Shooting Sports Foundation. “National Shooting Sports Foundation® Report: NSSF-Adjusted NICS – Historical Monthly Chart.” Proprietary data supplied on request and posted with NSSF permission. 1 Jul 2020.
Bureau of Labor Statistics. “Labor Force Statistics from the Current Population Survey; All employees, thousands, coal mining, seasonally adjusted.” Data extracted 16 Jul 2020.
U.S. Energy Information Administration. “Table 6.1 Coal Overview.” Online data from Monthly Energy Review. 25 Jun 2020.
U.S. Energy Information Administration. Short Term Energy Outlook. 7 Jul 2020.
U.S. Energy Information Administration. “Monthly Energy Review: Table 11.1 Carbon Dioxide Emissions From Energy Consumption by Source.” 25 Jun 2020.
U.S. Border Patrol. “U.S. Border Patrol Southwest Border Apprehensions FY 2020.” 9 Jul 2020.
U.S. Border Patrol. “Total Illegal Alien Apprehensions By Month Fiscal Years 2000-2018.” Undated. Accessed 16 Jul 2020.
U.S. Bureau of Economic Analysis. Corporate Profits After Tax (without IVA and CCAdj) (CP), retrieved from FRED, Federal Reserve Bank of St. Louis. 16 Jul 2020.
U.S. Bureau of Economic Analysis. Line 45. “National Income and Products Accounts, Table 1.12. National Income by Type of Income, Annual.” 25 Jun 2020.
U.S. Bureau of Economic Analysis. “National Income and Products Accounts, Table 1.12. National Income by Type of Income, Quarterly.” 25 Jun 2020.
Egan, Matt. “The bull market turns 10 years old.” CNN Business. 11 Mar 2019.
Menton, Jessica and Nathan Bomey. “Dow endures worst day since ‘Black Monday’; S&P 500 enters bear market as coronavirus spreads economic gloom.” 12 Mar 2020.
Yahoo! Finance. “Dow Jones Industrial Average.” Accessed 16 Jul 2020.
Yahoo! Finance. “S&P 500.” Accessed 16 Jul 2020.
Yahoo! Finance. “NASDAQ Composite.” Accessed 16 Jul 2020.
Bureau of Labor Statistics. “Consumer Price Index – All Urban Consumers.” Data extracted 16 Jul 2020.
Bureau of Labor Statistics. “Employment, Hours, and Earnings from the Current Employment Statistics survey (National); Average Weekly Earnings of All Employees, 1982-1984 Dollars.” Data extracted 16 Jul 2020.
Bureau of Labor Statistics. “Employment, Hours, and Earnings from the Current Employment Statistics survey (National); Average Weekly Earnings of production and nonsupervisory employees, 1982-1984 Dollars.” Data extracted 16 Jul 2020.
University of Michigan Surveys of Consumers. “The Index of Consumer Sentiment.” 26 Jun 2020.
National Association of Realtors. “Sales Price of Existing Single-Family Homes.” 22 Jun 2020.
S&P Dow Jones Indices. “S&P CoreLogic Case-Shiller U.S. National Home Price NSA Index.” Data extracted 16 Jul 2020.
U.S. Census Bureau. “Time Series: Not Seasonally Adjusted Home Ownership Rate.” Data extracted 16 Jul 2020.
U.S. Bureau of Economic Analysis. “U.S. International Trade in Goods and Services, May 2020.” 2 Jul 2020.
U.S. Bureau of Economic Analysis. “Table 1, U.S. Trade in Goods and Services, 1992-present.” 2 Jul 2020.
U.S. Bureau of Economic Analysis. “Table 3. U.S. International Trade by Selected Countries and Areas: Balance on Goods and Services.” 2 Jul 2020.
Berchick, Edward R. et al. “Health Insurance Coverage in the United States: 2018.” U.S. Census Bureau. 10 Sep 2019.
Centers for Disease Control and Prevention; National Health Interview Survey. “Health Insurance Coverage: Estimates From the National Health Interview Survey, January – June 2019.“ 28 May 2020.
Witters, Dan. “U.S. Uninsured Rate Rises to Four-Year High.” Gallup. 23 Jan 2019.
Kliff, Sarah. “Trump is slashing Obamacare’s advertising budget by 90%.” Vox.com. 31 Aug 2017.
Lee, MJ et al. “GOP Obamacare repeal bill fails in dramatic late-night vote.” CNN.com. 28 Jul 2017.
Mukherjee, Sy. “The GOP Tax Bill Repeals Obamacare’s Individual Mandate. Here’s What That Means for You.” Fortune. 20 Dec 2017.
Haberman, Maggie and Robert Pear. “Trump Sided With Mulvaney in Push to Nullify Health Law.” The New York Times. 27 Mar 2019.
Texas v U.S. (5th Cir. 2020)
Luthi, Susannah. “Trump administration asks Supreme Court to overturn Obamacare” Politico.com. 25 Jun 2020.
U.S. Department of Agriculture, Food and Nutrition Service. “Supplemental Nutrition Assistance Program (Data as of June 12 2020).” 16 Jul 2020.
U.S. Department of Agriculture, Food and Nutrition Service. Supplemental Nutrition Assistance Program (SNAP) data, FY 69 through FY18 National View Summary. ZIP Excel files. Accessed 16 Jul 2020.
U.S. Department of Agriculture, Food and Nutrition Service. “Regulatory Impact Analysis, 7 CFR Part 273, Supplemental Nutrition Assistance Program: Requirements for Able-Bodied Adults Without Dependents.” 5 Dec 2019.
The White House. “Bill Announcement.” 19 Mar 2020.
“Families First Coronavirus Relief Act.” Public Law 116–127. 18 Mar 2020.
U.S. Department of Agriculture, Food and Nutrition Service. “FNS Response to COVID-19” Website, accessed 16 Jul 2020.
Administrative Office of the U.S. Courts. “Judicial Confirmations for January 2019,” archived web listing of confirmations in 115th Congress. Accessed 16 Jul 2020.
Administrative Office of the U.S. Courts. “Confirmation Listing” web listing of confirmations in 116th Congress. Accessed 16 Jul 2020.
Administrative Office of the U.S. Courts. “Judicial Confirmations for January 2011,” archived web listing of confirmations in 110th Congress. Accessed 16 Jul 2020.
Administrative Office of the U.S. Courts. “Judicial Confirmations for January 2013,” archived web listing of confirmations in 111th Congress. Accessed 16 Jul 2020.
U.S. Treasury. “Debt to the Penny” Data extracted 16 Jul 2020
U.S. Treasury. “Final Monthly Treasury Statement.” Oct 2019.
Congressional Budget Office. “Baseline Budget Projections as of March 6, 2020.” 19 Mar 2020.
“CBO Updates Budget Projections Before Coronavirus Impact.” Committee for a Responsible Federal Budget. 19 Mar 2020.
Congressional Budget Office. “Federal Debt: A Primer.” 12 Mar 2020.
Committee for a Responsible Federal Budget. “CBO Releases New Economic Projections” 8 Jul 2020
U.S. Energy Information Administration. “U.S. Field Production of Crude Oil.” Accessed 16 Jul 2020.
U.S. Energy Information Administration. “Table 3.3a Petroleum Trade: Overview.” Monthly Energy Review. Accessed 16 Jul 2020.