Summary
Highlights from our latest update:
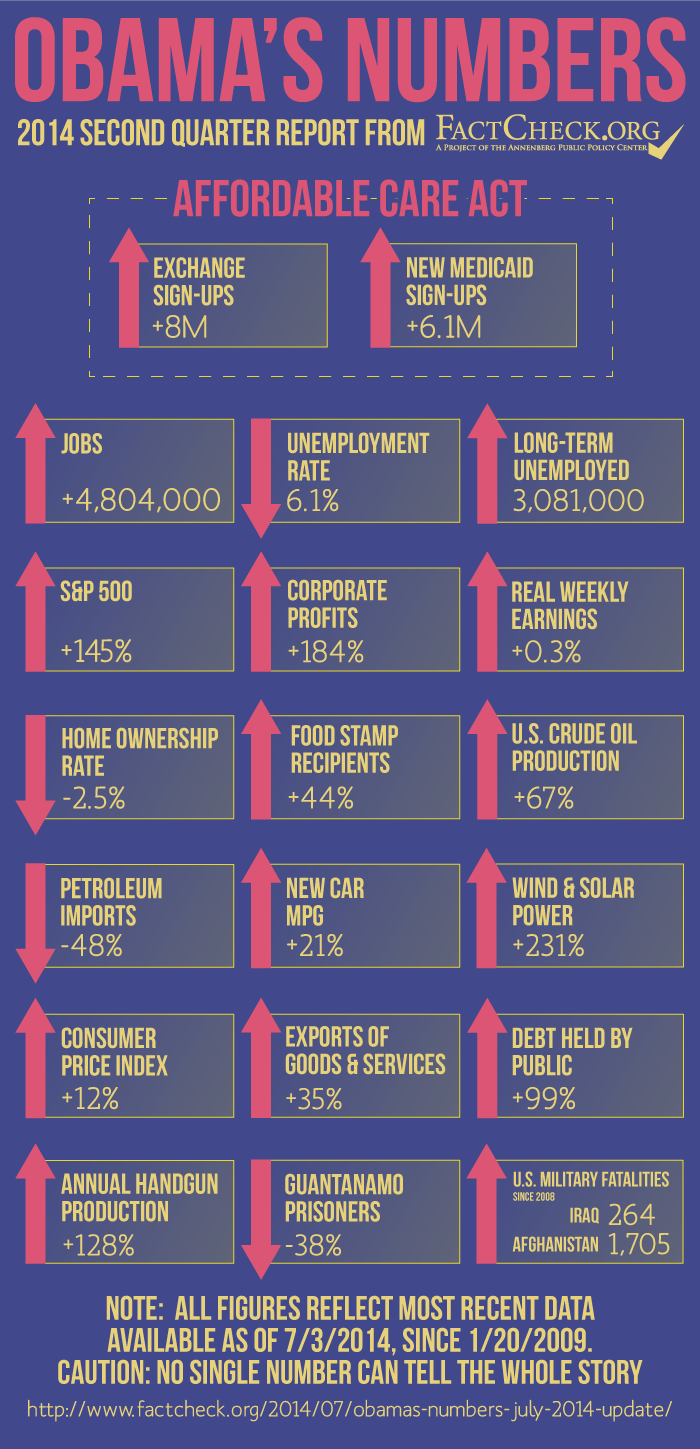
- Under the Affordable Care Act, millions of Americans have signed up for private health insurance and for Medicaid — though exactly how many remains unclear.
- All job losses during the great recession have been erased, but long-term joblessness remains much higher than when Obama first took office.
- Corporate profits and stock prices continue to set records, while workers’ wages remain stagnant and the home ownership rate continues to decline.
- The number of food-stamp recipients has retreated from the record high of 2012; fewer beneficiaries have been added under Obama than were added under George W. Bush.
- Under Obama, federal spending has risen more slowly than the rate of inflation. But the total debt owed to the public has nearly doubled during Obama’s tenure, and large annual deficits are projected to continue as far as the eye can see.
- Handgun production rose 128 percent during Obama’s first term, and sales continue to boom.
Analysis
As we do every three months, we offer here a fresh update of selected statistical indicators of what has happened since Barack Obama first took the oath of office in January 2009. Some are positive and some are not, but all are from sources we consider solid and reliable. And as usual, we caution that no single number or collection of numbers can tell the entire story.
Affordable Care Act
Information on the effects of Obamacare continues to accumulate, showing the law is reaching millions of its intended beneficiaries.
- The administration’s most recent tally shows just over 8 million people signed up for private health insurance during the initial enrollment period (which is now over) via the once-troubled HealthCare.gov website and the several state-run insurance exchanges. Nearly half of those signed up in March, as the deadline was approaching.
- There also has been a surge in new sign-ups for Medicaid, the joint federal-state insurance program for low-income people. The administration’s latest tally shows nearly 6.1 million Medicaid beneficiaries had been added as of the end of April, compared with the July-September quarter of last year.
A poll by the nonpartisan Kaiser Family Foundation indicates that 57 percent who signed up for private insurance through exchanges had no coverage before. The poll also showed that the majority of those who signed up for individual policies — either through exchanges or directly with insurance companies — rate their Obamacare-compliant coverage as excellent or good, believe it is a good value for what they pay for it, and say they are satisfied with various aspects of their plans.
To be sure, an unknown number of those who signed up for private coverage through the exchanges failed to make their first premium payments, and so never completed enrollment. How many? Early reports ranged widely, most commonly estimating that 80 percent to 90 percent who signed up had also paid. Dan Mendelson, CEO of the consulting company Avalere Health, said he expects that between 5 percent and 10 percent of Obamacare enrollments will eventually end up being unpaid.
As for the 6 million new Medicaid beneficiaries, an unknown portion would have been added even without Obamacare. However, states that have chosen to expand eligibility under the ACA saw a 15.3 percent increase, while states that declined to expand eligibility experienced only a 3.3 percent increase.
Furthermore, the number of new Medicaid sign-ups is likely to grow further. Some states have yet to report April results, and a few states are still debating whether to implement expanded coverage. New Medicaid beneficiaries may sign up at any time.
Jobs
The economy as of June had gained just over 4.8 million jobs since Obama took office in January 2009. The unemployment rate has declined to 6.1 percent, which is 1.7 points lower than when he took office and 3.9 points lower than it was at its worst point during October 2009.
Since our last report, the economy has not only regained the 4.3 million jobs lost during Obama’s first 13 months in office, but also has regained the 4.4 million jobs lost during the 12 months before he entered the White House. Total employment now is at a record high — 415,000 jobs higher than the peak number reached before the great recession of 2007-2009.
Many without jobs continue to struggle, however. Despite improvements in recent months, the number of those who have been out of work for at least 27 weeks — the so-called long-term unemployed — is still more than 3 million, and 382,000 higher than when Obama took office. The average number of weeks that the unemployed have been without work also has continued to decline. But it is still 33.5 weeks — or 13.7 weeks longer than the average duration of joblessness for the month Obama entered the White House.
Record Profits, Soaring Stocks
Meanwhile, corporate profits keep setting records. Even after taxes, corporate profits were running at an annual rate of more than $1.9 trillion in the January-March quarter of 2014, the most recent for which figures are available. That’s the highest on record — and an increase of 184 percent from the recession-wracked fourth quarter of 2008, just before the start of Obama’s tenure.
Corporate stocks also have been rising. As of the close of the market on July 2, the Standard & Poor’s 500 stock index was 145 percent higher than it was when Obama first took office.
Other market indicators also have soared. The Dow Jones Industrial Average was up 114 percent, and the NASDAQ Composite index had more than tripled, rising by 209 percent.
Stagnant Wages, Declining Home Ownership
Even for those who have jobs, wages have risen so slowly they have barely kept up with historically low rates of inflation. Average weekly earnings of workers on payrolls, measured in inflation-adjusted dollars, have edged up a scant 0.3 percent between Obama’s first month in office and May 2014, the most recent on record. And there’s no clear upward trend. A year ago we reported a 0.1 percent increase in the real earnings figure in our July 2013 update, and six months ago the increase we reported in our January 2014 update was exactly the same as now — 0.3 percent.
Relatively fewer people now own their homes. Under Obama, the home ownership rate has continued to slide, declining by 2.5 percentage points since he took office. It stood at 65 percent in the January-March quarter, according to U.S. Census figures. (The decline actually began in 2004, when the rate peaked at 69.4 percent as the housing bubble was inflating.)
Food Stamps
The number of low-income people on food stamps (officially called Supplemental Nutrition Assistance Program, or SNAP) has declined recently from the record levels reached during Obama’s tenure. The most recent figures from the Department of Agriculture put the number receiving benefits at 46.1 million as of March 2014. That’s down from the nearly 47.8 million who were getting benefits in December 2012 — a record. But the most recent number is still more than 14 percent of the entire U.S. population, and is an increase of 44 percent since the month Obama first took office.
The increase in food stamp beneficiaries is due partly to economic pressures, and partly to liberalizations in both benefits and eligibility under Obama and also under his predecessor. We covered those in some detail back in 2012 when GOP presidential candidate Newt Gingrich accused Obama of being the “food stamp president.” The number of food stamp beneficiaries increased by 14.7 million during Bush’s two terms in office, which exceeds the current increase under Obama of 14.1 million.
One factor fueling the enrollment rise is an increase in benefit levels enacted as part of Obama’s 2009 economic stimulus program. That “temporary” increase was extended several times, and finally lapsed on Nov. 1, 2013. The average monthly benefit in March now has declined to $257 per household, down from an average of nearly $290 during fiscal year 2010, when the temporary boost was in full force. In February, Obama signed another reduction in benefits that had been passed by Congress and will affect about 4 percent of current recipients over the next several years.
Booming Oil, Gas, Wind and Solar
Production of crude oil in the U.S. now has increased 67 percent since Obama took office, while imports of foreign oil and petroleum products have declined by 48 percent, as measured by the Energy Information Administration figures, comparing the most recent three-month period with the last quarter of 2008.
As a consequence, U.S. dependency on imported oil has dropped sharply. The nation imported 30 percent of what it consumed in the first five months of 2014, according to the most recent EIA figures. (See Table 3.3a, “net imports” as a percent of “product supplied.”) That’s a drop of 27 percentage points from 2008, when the U.S. imported 57 percent.
The decline actually began in George W. Bush’s second term, after U.S. dependency peaked at 60.3 percent in 2005. But the trend has gathered momentum under Obama.
As we’ve said before, the U.S. energy boom is a result primarily of the use of new drilling technology by the industry, not of any policy changes in Washington. But another factor behind reduced U.S. dependency on imported oil is declining demand for gasoline, partly due to motorists buying more fuel-efficient automobiles.
The latest figures from the University of Michigan’s Transportation Research Institute show the average EPA city/highway “window sticker” mileage of cars and light trucks sold in June was 25.5 miles per gallon, an improvement of 21.4 percent over the average for vehicles sold in the month that Obama took office.
Washington is now calling for even greater efficiency in the future. The Obama administration has put in place requirements that cars and light trucks average 54.5 mpg by model year 2025. But it remains to be seen whether the industry can produce such vehicles and get Americans to buy them, and whether future presidents will stick to Obama’s ambitious goal.
Under Obama, wind and solar power has more than tripled. In the most recent 12 months on record (ending in April) electricity generated by wind and solar had increased by 231 percent over the total for 2008. That was spurred in part by large federal tax subsidies for wind and solar generation.
Wind and solar sources still supply relatively little of the nation’s total electrical consumption, however. Wind and solar accounted for just under 4.4 percent of all electricity generated in the U.S. during all of 2013, up from 1.4 percent in 2008. Coal still accounts for the biggest share, followed by natural gas and nuclear power.
Moderate Inflation
Consumer prices have risen slowly under Obama. As of May 2014, the Consumer Price Index has risen 11.9 percent since he first took office.
The highly visible price of regular gasoline has continued to fluctuate at well below the record high of more than $4 per gallon that it reached in June and July 2008, before he took office. In the week ending June 30, the average national price stood at $3.70 per gallon, which is just a bit more than double what it was the week he took office. But that was when the price had plunged to an unusually low level due to a worldwide recession that had pushed down demand.
Disappointing Exports
The president hasn’t said much lately about the goal he set in his 2010 State of the Union address, when he said, “We will double our exports over the next five years.” That is now hopelessly out of reach.
As of the first quarter of 2014, seasonally adjusted exports of goods and services have increased only 34.7 percent since the quarter before Obama took office, according to the most recent data from the U.S. Commerce Department. That’s being charitable to the president; compared with the quarter in which he actually made his promise to double exports by the end of this year, the increase has been only 30.9 percent.
Spending and Debt
Since Obama took office, federal spending has risen much more slowly than it did under his predecessor. But annual deficits, while shrinking, remain high, with no end in sight. Obama’s legacy surely will include a doubling of the most important measure of the federal debt during his tenure.
Federal outlays for the current fiscal year are estimated to be $3.65 trillion, according to figures released in March along with the president’s proposed budget for fiscal 2015. We calculate that to be just 10.1 percent higher than fiscal 2009 spending levels he inherited from George W. Bush. (Fiscal 2009 began nearly four months before Obama took office, and spending levels were mainly set by Bush. As we’ve detailed elsewhere, we attribute — at most –$203 billion of actual FY 2009 outlays to increases signed by Obama.)
That 10.1 percent increase in spending is below the nearly 12 percent rate of inflation, as measured by the Consumer Price Index since Obama took office.
Obama’s increase in federal spending over five years contrasts dramatically with the 78 percent increase during Bush’s eight years (FY 2001 vs FY 2009, minus the $203 billion we attribute to Obama). And that is giving Bush the benefit of the doubt. A Republican economist, Daniel Mitchell of the libertarian CATO Institute, has figured that only $140 billion of fiscal 2009 spending can be attributed to Obama. Using that lower figure would make Bush’s spending increase a bit higher, and Obama’s a bit lower.
To be sure, Obama would have preferred a higher rate of federal spending than he was able to get through Congress after Republicans took control of the House in January 2011. Obama agreed to cuts as part of budget deals with congressional Republicans, including one that averted the “fiscal cliff” and another that ended a government shutdown.
But the chronic gap between what the government spends and what it collects in revenues continues. Under current law, the nonpartisan Congressional Budget Office projects the current year’s deficit will be $492 billion, and will fall to $469 billion next year. But then CBO projects annual deficits will start to rise again in future years, with no end to the red ink in sight.
Currently, total federal debt stands at nearly $17.6 trillion, which is 66 percent higher than when Obama took office. That figure includes money the government owes to itself, chiefly through the Social Security trust funds. But when it comes to what the government owes to the public — a figure that economists consider more important — the debt almost exactly doubled since Obama took office. As of June 30, debt owed to the public was just under $12.6 trillion, an increase of 99.2 percent under Obama. At the current rate, that will reach 100 percent any day now.
(A technical note for fans of budget trivia: The debt actually declined slightly since our last report. But that’s only because the government typically receives an unusually high amount of revenue in April, when annual tax returns are due, and in June, when quarterly estimated payments and payroll taxes are due.)
Gun Production
Gun sales have boomed under Obama, who did not deliver on campaign pledges to restore the ban on “assault weapons” (firearms makers prefer the term “modern sporting rifles”) that expired in 2004, or promises to require background checks for sales by non-dealers at gun shows and on the Internet.
Reliable statistics on total sales don’t exist, but U.S. makers of firearms do report figures on new weapons produced each year. U.S. production of new handguns — revolvers and pistols — topped 4 million in 2012, the most recent year for which the government has released figures. That’s more than double the figure for 2008 — an increase of 128 percent during the president’s first term alone.
There’s good evidence that the handgun sales boom continued strongly into 2013. Smith & Wesson Holding Corp., a leading manufacturer of pistols, revolvers and rifles, just announced the highest profits and sales in its history for the fiscal year that ended April 30. It said the number of firearms it produced in that period was 16.2 percent higher than during the previous fiscal year. The company’s president and CEO, James Debney, cited “robust consumer demand for our products” as the main reason.
In 2013, in the wake of the Newtown, Connecticut, school massacre that left 20 children dead, Obama tried and failed to push through Congress a package including expanded background checks of gun buyers and a renewed ban on some “assault weapons.” He recently called that failure the “biggest frustration” of his presidency.
Guantanamo
The president also failed to deliver on his intention to close the U.S. detention facility at Guantanamo Naval Base in Cuba. Since our last report, five senior Taliban commanders were released from there in exchange for the return of Army Sgt. Bowe Bergdahl. That brought the total number being held there to 149. It represents a decline of 38 percent compared with the 242 who were being held there when he entered the White House in 2009.
Military Fatalities
Even with the U.S. role in Afghanistan winding down, casualties continue. The total number of U.S. military fatalities in that country has now grown to 1,705, according to iCasualties.org.
The number of U.S. military fatalities in the Iraq war since 2008 is 264, including one soldier who died in a vehicle accident in Bahrain two months after Obama pulled out all of the troops at the end of 2011. But more recently, he announced he is sending hundreds of troops back to Iraq as “advisers” and to provide embassy security because of the crisis there. But so far none has been reported as killed or wounded.
Correction, July 8: Our original article mistakenly said “automatic pistols” when referring to handgun production of revolvers and pistols.
— by Brooks Jackson
Sources
U.S. Department of Health and Human Services; Office of the Assistant Secretary for Planning and Evaluation. “Health Insurance Marketplace: Summary Enrollment Report For The Initial Annual Open Enrollment Period.” 1 May 2014.
U.S. Department of Health and Human Services; Centers for Medicare & Medicaid Services. “Medicaid & CHIP: April 2014 Monthly Applications,Eligibility Determinations, and Enrollment Report.” 4 Jun 2014.
Hamel, Liz et al. “Survey of Non-Group Health Insurance Enrollees.” Kaiser Family Foundation. 19 Jun 2014.
Duke University Center for Health Policy & Inequalities Research; U.S. Health Policy Gateway. “Premium Payments on ACA Health Exchanges.” May 2014.
Mangan, Dan & Jodi Gralnick. “All over the map: States’ ‘paid’ Obamacare rates.” CNBC. 14 Mar 2014.
Kaiser Family Foundation. “Status of State Action on the Medicaid Expansion Decision, 2014.” 10 Jun 2014.
Bureau of Labor Statistics. “Employment, Hours, and Earnings from the Current Employment Statistics survey (National); Total Nonfarm Employment, Seasonally Adjusted.” Data extracted 3 Jul 2014.
Bureau of Labor Statistics. “Labor Force Statistics from the Current Population Survey; Unemployment Rate, Seasonally Adjusted.” Data extracted 3 Jul 2014.
Bureau of Labor Statistics. “Labor Force Statistics from the Current Population Survey; Number Unemployed for 27 Weeks & Over, Seasonally Adjusted.” Data extracted 3 Jul 2014.
Bureau of Labor Statistics. “Employment, Hours, and Earnings from the Current Employment Statistics survey (National); Average Weekly Earnings of All Employees, 1982-1984 Dollars.” Data extracted 3 Jul 2014.
Federal Reserve Bank of St Louis. “Corporate Profits After Tax (without IVA and CCAdj) (CP).” Data extracted 3 Jul 2014.
U.S. Census Bureau. “Time Series: Seasonally Adjusted Home Ownership Rate.” Data extracted 3 Jul 2014.
Google Finance. “S&P 500.” Historical prices. Accessed 2 Jul 2014.
Google Finance. “Dow Jones Industrial Average.” Historical prices. Accessed 2 Jul 2014.
Google Finance. “NASDAQ Composite.” Historical prices. Accessed 2 Jul 2014.
U.S. Department of Agriculture, Food and Nutrition Service. “Supplemental Nutrition Assistance Program (Data as of June 6, 2014).” Data extracted 3 Jul 2014.
Plumber, Brad. “Food stamps will get cut by $5 billion this week — and more cuts could follow.” Washington Post “Wonkblog.” 28 Oct 2013.
U.S. Energy Information Administration. “U.S. Crude Oil Production.” Short Term Energy Outlook. 10 Jun 2014. Accessed 3 Jul 2014.
U.S. Energy Information Administration. “Table 3.3a. Monthly Energy Review.” Jun 2014.
University of Michigan Transportation Research Institute. “Average sales-weighted fuel-economy rating (window sticker) of purchased new vehicles for October 2007 through March 2014.” 2 Jul 2014.
U.S. Energy Information Administration. Electric Power Monthly, “Table 1.1.A. Net Generation from Renewable Sources: Total (All Sectors), 2004-January 2014.” 23 Jun 2014.
Bureau of Labor Statistics. “Consumer Price Index – All Urban Consumers.” Data extracted 3 Jul 2014.
U.S. Energy Information Administration. “Weekly U.S. Regular All Formulations Retail Gasoline Prices.” Data extracted 3 Jul 2014.
U.S. Department of Commerce, Bureau of Economic Affairs. “Table 1. U.S. International Transactions: Exports of Goods and Services.” 18 Jun 2014.
Office of Management and Budget. “Table 1.1—Summary of Receipts, Outlays, and Surpluses or Deficits (-): 1789–2019.” Mar 2014.
Jackson, Brooks. “Obama’s Spending: ‘Inferno’ or Not?” FactCheck.org. 4 Jun 2012.
U.S. Congressional Budget Office. “Updated Budget Projections: 2014 to 2024.” 14 Apr 2014.
U.S. Congressional Budget Office. “April 2014 Baseline” 14 Apr. 2014.
U.S. Treasury. “The Debt to the Penny and Who Holds It.” 1 Jul 2014. Data extracted 3 Jul 2014.
U.S. Bureau of Alcohol, Tobacco, Firearms and Explosives, “Annual Firearms Manufacturing and Export Report; Year 2012.” 17 Jan 2014. Accessed 3 Jul 2014.
U.S. Bureau of Alcohol, Tobacco, Firearms and Explosives. “Annual Firearms Manufacturing and Export Report; Year 2008.” 8 Mar 2011. Accessed 3 Jul 2014.
Smith & Wesson Holding Corp. “Smith & Wesson Holding Corporation Reports Fourth Quarter and Full Year Fiscal 2014 Financial Results.” News release. 19 Jun 2014.
Weisman, Jonathan. “Senate Blocks Drive for Gun Control.” New York Times. 17 Apr 2013.
Liptak, Kevin. “Exasperated Obama: Inability to get tougher gun laws shameful.” CNN. 10 Jun 2014.
Parsons, Christi & Michael A. Memoli, David S. Cloud. “Obama adamantly defends Taliban prisoner swap that freed U.S. soldier.” Los Angeles Times. 3 Jun 2014.
New York Times; The Guantanamo Docket. “A History of the Detainee Population.” 31 May 2014.
iCasualties.org “Operation Enduring Freedom/Afghanistan; Afghanistan Coalition Military Fatalities by Year.” Accessed 3 Jul 2014.
iCasualties.org. “Operation Iraqi Freedom; Iraq Coalition Military Fatalities by Year.” Accessed 3 Jul 2014.
Lederman, Josh. “Obama Sends More Troops To Iraq, Raising Total To About 750.” Talking Points Memo. 1 Jul 2014.