Summary
Highlights from our latest update:
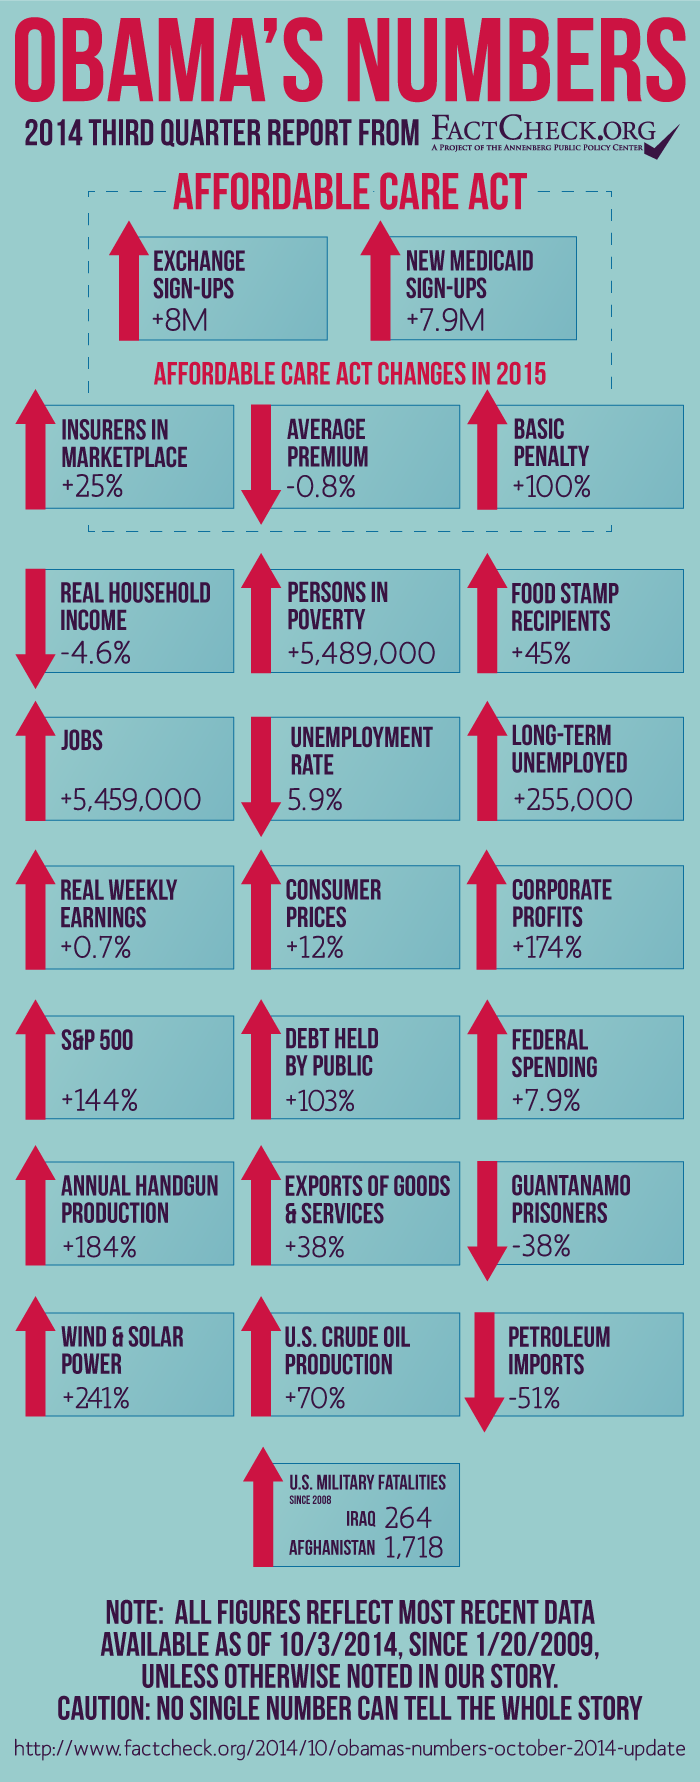
- Millions of Americans have gained health insurance because of Obamacare, and the number signing up for Medicaid keeps rising. But the exact number of newly insured won’t be known for some time.
- Those signing up for private insurance in Obamacare marketplaces for 2015 will find 25 percent more insurance companies competing for their business.
- Marketplace premiums for 2015 are averaging 0.8 percent lower than this year, according to preliminary data.
- Median household income declined 4.6 percent during Obama’s first five years, and nearly 5.5 million more Americans were living in poverty last year than before he took office.
- The federal debt owed to the public has more than doubled under Obama, rising by 103 percent. But federal spending has gone up only 7.9 percent.
- This year the economy is adding jobs rapidly and paychecks are rising faster than inflation at last. Real weekly earnings for workers, adjusted for inflation, averaged 0.7 percent higher in August than when Obama entered office.
- And the total number of jobs in September was nearly 5.5 million higher than when Obama was first sworn in. Four times more jobs have been added under Obama than were gained in George W. Bush’s eight years in office.
- Under Obama, U.S. crude oil production has increased by 70 percent, while oil imports have gone down by more than half.
- New figures show annual handgun production has nearly tripled under Obama, rising by 184 percent as of last year.
Analysis
As we do every three months, we offer here a fresh update of selected statistical indicators of what has happened since Barack Obama first took the oath of office in January 2009. Some are positive and some are not, but all are from sources we consider solid and reliable. And as usual, we caution that no single number or collection of numbers can tell the entire story.
Affordable Care Act
We again begin with the Affordable Care Act. It’s still too early to know precisely how many previously uninsured people now have health coverage because of the ACA (also known as “Obamacare,” a term the administration has come to embrace). Some estimates put the figure at more than 10 million, or even up to 11 million.
One recent indication comes from a quarterly survey by the Centers for Disease Control and Prevention, which found that during the first three months of 2014 a total of 1.4 percent of all U.S. residents under age 65 had obtained private health insurance through the ACA’s new exchanges. The survey also found that the number of uninsured had dropped to 13.1 percent of the population in early 2014, down from 14.4 percent last year. Both figures will change significantly in subsequent surveys, because the survey is conducted throughout the January to March period. A large number of people waited until the final days of March to sign up, and coverage did not become effective for many until later in the year.
What we can say with confidence so far is that just over 8 million people signed up for private health insurance during the initial enrollment period, according to the administration’s last tally. That number is unchanged from our previous update. The figure includes an unknown number of people who signed up but later failed to pay their premium, thus failing to obtain coverage.
We also know that at least 7.9 million more people were covered by Medicaid as of July, compared with the July through September period last year, before the ACA’s open enrollment period began. That number has grown significantly from the 6.1 million we reported in our previous update. That number continues to grow because eligible people may sign up for Medicaid any time, with no closed enrollment period.
An unknown number of those 7.9 million additional Medicaid enrollees would have gained coverage even without Obamacare, which expanded coverage to those with somewhat higher incomes than before in most states. But according to the most recent report from the Centers for Medicare & Medicaid Services, the 7.9 million figure includes nearly 6.9 million in the 27 states (and District of Columbia) where Medicaid eligibility has been expanded, and just over 1 million in the 23 states that did not expand coverage.
Since our last report, the U.S. Census Bureau has released its annual estimate of those who lack medical insurance, finding that 42 million people lacked health insurance in 2013. But Census won’t have comparable figures for 2014 until late next year. So we’ll have to wait until then to get the best measure of how effective the new law has been in reducing the uninsured population.
Obamacare in 2015
Meanwhile, the insurance exchanges’ second annual open enrollment period is approaching. It will run from Nov. 15 through Feb. 15. And we can report that those signing up for coverage for 2015 will have more choices, and in many cases will have lower premiums than in 2014.
Compared with this year, there are 25 percent more insurance companies offering health plans through the exchanges for 2015, according to preliminary data released by the Department of Health and Human Services. That means more competition, and greater choice.
Meanwhile, 2015 premiums may cost slightly less than in 2014, at least on average, according to a separate survey by the nonpartisan Kaiser Family Foundation, which tracks trends in health insurance coverage. KFF reports that for the benchmark “silver plan,” which is the second-lowest in cost of the standard options offered, the average premium will be 0.8 percent lower than in 2014, based on an analysis covering the largest cities in 15 states and the District of Columbia where information from rate filings is available.
That KFF finding on premiums is preliminary. It could change when comprehensive data from all 50 states are available. And it is only an average of premium changes that vary quite widely. For example, KFF found that in Nashville the silver plan will cost 8.7 percent more than in 2014, while in Denver the premium will be 15.6 percent less. The foundation advised consumers to shop around for the best deal in their market.
One change that is nearly certain is that the law’s basic penalty for failing to obtain coverage will double in 2015, going from 1 percent of household income for those who are uninsured this year (to be paid in 2015 when federal income taxes are due) to 2 percent of household income for those who don’t get coverage next year. The minimum penalty, for those with very low income, will more than triple. It goes from $95 per adult this year to $325 in 2015. The penalty amounts have been part of the law since it passed in 2010, and will go into effect Jan. 1 unless the law is amended, which isn’t likely.
Income, Poverty and Food Stamps
Also since our last report, the Census has released annual figures on income and poverty covering 2013. They provide a bleak picture of the economic well-being of most Americans during the first five years of Obama’s tenure.
Median household income rose just slightly to $51,939 in 2013, Census reported. In “real” income, adjusted for inflation, that was 0.3 percent higher than in 2012, but still 4.6 percent below 2008, the year before Obama first took office, when the first effects of the worst recession since the Great Depression were just starting to be felt. And it is 8.7 percent below the peak year of 1999.
The same Census report showed that although nearly 1.2 million fewer people were living in poverty in 2013 than the year before, the number still remains nearly 5.5 million higher than in 2008. The official poverty rate — meaning the percentage of the population living below the poverty line — dropped 0.5 percent in 2013, but it still remained 1.3 percent higher than in 2008.
Meanwhile, the number of people receiving benefits under the Supplemental Nutrition Assistance Program, formerly known as “food stamps,” bounced back up by nearly 400,000 since the period covered in our previous update. As of June, the most recent period for which the government has released monthly figures, the total stood at 46.5 million people. That’s 2.7 percent below the peak reached in December 2012, but it’s still 14.5 million, or more than 45 percent, higher than the month before the president was first sworn in.
Jobs & Unemployment
As of September, the U.S. had 5,459,000 more people employed than it did when Obama took office in 2009. And the official unemployment rate had dipped to 5.9 percent, which was 1.9 percentage points below where it was when he first took office.
But scars from the great recession of 2007-2009 remain. There were still nearly 3 million people suffering from long-term unemployment — out of work for 27 weeks or longer — a figure that was 255,000 higher than it was when Obama entered office. And the average number of weeks that the unemployed have been without work was 31.5 weeks — which was 11.7 weeks longer than the average duration of joblessness for the month Obama entered the White House.
Wages & Inflation
One economic indicator is currently showing improvement for the economic well-being of workers. Real Weekly Earnings (which are adjusted for inflation) were 0.9 percent higher in August than they were last December, and 0.7 percent higher than when Obama first took office. So this year, workers’ paychecks are finally keeping ahead of price increases.
One reason is that inflation continues to be historically moderate. The Consumer Price Index as of August had risen just 12 percent since the start of Obama’s first term. For comparison, the CPI rose 9.1 percent during Obama’s first four years compared with 10.6 percent during the previous four years.
Profits & Markets
The Obama years have brought dramatically better times for corporations and their stockholders.
Corporate profits (after taxes) reached a record annual rate of more than $1.8 trillion in the second quarter of this year, the most recent figures available. That was 174 percent higher than the quarter before Obama first entered the White House. (The rise is somewhat lower than the 184 percent increase we reported in July. After we posted that report the Commerce Department issued annual revisions to its historical figures for gross domestic product and its components. These included reductions in estimates of corporate profits.)
And stock prices have done very well under Obama. The Standard & Poor’s 500-stock index stood at 142 percent higher at the close on Oct. 2 than it did the day Obama took office, and just slightly below where it was at our last update. Other stock indexes show similarly robust gains. The Dow Jones Industrial Average has also more than doubled, rising 111 percent during Obama’s tenure, and the NASDAQ Composite index is up 208 percent, more than tripling during the same period.
Debt & Deficits
The federal debt held by the public, which had not quite doubled as of our last report, is now nearly 103 percent higher than it was the day he first took office. The “total” debt, which includes money the government owes to itself, has gone up by more than 68 percent.
Both figures are staggering, but are not entirely Obama’s fault. As we’ve often noted, the FY2009 federal deficit was running at a rate of $1.2 trillion on the day he took office in the midst of a financial crisis.
The debt is now growing less rapidly than during Obama’s first years, which saw a string of trillion-dollar-plus annual deficits. CBO projects this year’s deficit will be $506 billion, so the deficit has fallen by more than half since he took office. But CBO also projects that under current law, deficits will begin to turn up again after next year, with no end in sight.
Spending
But a fact that may surprise Obama’s critics is that Obama’s spending increases have been historically modest — much smaller than his predecessor’s, and well below the rate of inflation. Federal spending in the current fiscal year, which ends this month, is running only 7.9 percent higher than it was when the president took office. This increase is well below the 12 percent rise in the Consumer Price Index, which we’ve mentioned.
That’s also lower than the 10.1 percent increase that we reported in our previous update. Since then, official estimates of current fiscal year outlays have been reduced.
We base our 7.9 percent figure on the administration’s most recent projection of federal outlays, contained in the Office of Management and Budget’s “Mid-Session Review” issued July 11. OMB estimates spending of just under $3.6 trillion.
But the spending increase under Obama would be even lower — only 5.9 percent — if we used the most recent estimate of the nonpartisan Congressional Budget Office from August 27. CBO puts the current year’s outlays at just over $3.5 trillion. The final, actual spending figures for this year should be announced sometime next month, and we’ll report on them in our next update.
A technical note: Normally we would compare this fiscal year’s spending levels with actual results from fiscal 2009, which began nearly four months before Obama was first sworn in. But Obama’s “stimulus” bill and some other measures added to the fiscal 2009 spending levels that Obama inherited from George W. Bush. So in calculating our increase under Obama, we credit him, not Bush, with $203 billion in FY2009 spending, based on our earlier analysis of how much FY2009 spending increased because of measures Obama signed. Without that adjustment, the 7.9 percent figure would be even smaller.
To be sure, some of the spending restraint has been forced on Obama by a Republican-controlled House of Representatives. Even so, the contrast with the Bush administration’s spending increases is quite dramatic. Federal outlays rose nearly 33 percent during the first four fiscal years for which Bush signed the appropriations bills (FY2002 – 2005) and rose again by another 34 percent during the next four fiscal years, even subtracting $203 billion from FY2009 to adjust for Obama’s additions that year.
Unfulfilled Promises
In previous updates, we’ve kept track of some notable failures by Obama to deliver on promises regarding gun control, international trade and confinement of suspected terrorists. We update those here briefly.
Guns — Not only has Obama failed to get Congress to pass any gun control measures, his tenure has been marked by a remarkable increase in the production and sale of handguns. Government figures released since our last update show annual U.S. production of pistols and revolvers totaled nearly 5.2 million in 2013. That’s an increase of 184 percent over the figure for 2008. And the figures from the Bureau of Alcohol, Tobacco, Firearms and Explosives show that 96 percent of those produced in 2013 were not exported, but presumably sold in the United States.
The National Shooting Sports Foundation — the gun industry’s trade group — reports that 2013 was “a year unlike any other in the industry’s history,” and that sales in 2014 haven’t declined much from that record peak. The NSSF tracks approximate sales figures by adjusting FBI statistics on background checks to remove those not related to actual sales, such as checks required for concealed-carry permits.
Exports — Another Obama promise that has fallen flat is his 2010 vow to double U.S. exports by the end of this year. As of the most recent figures from the Commerce Department, U.S. exports of goods and services were running less than 38 percent higher in the April-June quarter of this year than they were in the last three months of 2008, before he first took office. They have gone up less than 4 percent in the most recent 12 months.
Guantanamo — And at last report, 149 prisoners remained at the U.S. detention facility for suspected terrorists at Guantanamo Naval Base in Cuba. That’s the same number as at the time of our last update three months ago, and only 38 percent fewer than were held there at his first inauguration. Obama ordered the facility closed two days after he first took office, but he hasn’t been able to make that happen.
Energy
Under Obama, the nation has taken great strides toward increasing domestic oil and natural gas production, and has more than tripled the production of electricity from wind and solar power.
Wind & Solar — Wind and solar power in the most recent 12 months on record (ending in July) was 241 percent higher than the total for 2008. That was spurred in part by large federal tax subsidies for wind and solar generation, all supported by Obama. But those increases still left the nation producing just under 4.4 percent of all its electricity generated from wind and solar in 2013, up from 1.4 percent in 2008. Coal still accounted for the biggest share, followed by natural gas and nuclear power.
Oil Production — Also during Obama’s tenure, new drilling technologies have brought about a revolution in U.S. oil production. During his time as president, production of crude oil in the U.S. has increased by nearly 70 percent, comparing the April-June quarter of 2014 with the last three months of 2008.
Oil Imports & Dependency — During the same period, net imports of petroleum have gone down by 51 percent. As a result, the U.S. imported only 28.3 percent of its petroleum during the first eight months of 2014, a dramatic plunge in dependency from the 57 percent that was imported in 2008. Those figures come from the U.S. Energy Information Administration’s “Monthly Energy Review” for Sept. 25, 2014, in table 3.3a, “Petroleum Trade.”
War Deaths
Since our last update, the U.S. has signed an agreement with Afghanistan that will allow up to 10,000 U.S. troops to remain there past the end of this year. The president also has authorized U.S. air strikes in Syria, and sent hundreds of additional military “advisers” to Iraq. Meanwhile, U.S. military deaths continue to mount. The total who have died in the Afghan conflict since 2008 has now reached 1,718, according to iCasualties.org. But so far there have been no more deaths in Iraq since our last update. The total who have died in that conflict since the end of 2008 remains at 264.
— by Brooks Jackson
Sources
Young, Jeffrey. “More Than 10 Million People Got Insurance Because Of Obamacare, Feds Say.” Huffington Post. 23 Jul 2014.
Ydstie, John. “Obamacare’s First Year: How’d It Go?” National Public Radio. 1 Oct 2014.
National Health Interview Survey Early Release Program. “Table 1. Percentages of persons under age 65 who were uninsured, had private health insurance coverage, and had public healthplan coverage at the time of interview, by year, and quarter: United States, January 2010–March 2014.” Centers for Disease Control and Prevention, National Center for Health Statistics. 14 Sep 2014.
Cohen, Robin A. and Michael E. Martinez. “Health Insurance Coverage: Early Release of Estimates From the National Health Interview Survey, January–March 2014.” Centers for Disease Control and Prevention, National Center for Health Statistics. 14 Sep 2014.
U.S. Department of Health and Human Services; Office of the Assistant Secretary for Planning and Evaluation. “Health Insurance Marketplace: Summary Enrollment Report For the Initial Annual Open Enrollment Period.” 1 May 2014.
U.S. Department of Health and Human Services; Centers for Medicare & Medicaid Services. “Medicaid & CHIP: July 2014 Monthly Applications, Eligibility Determinations, and Enrollment Report.” 22 Sep 2014.
U.S. Census Bureau. “Income, Poverty and Health Insurance Coverage in the United States: 2013.” 16 Sep 2014.
“Open Enrollment Period.” Healthcare.gov. Website accessed 3 Oct 2014.
Gunja, Munira Z. and Emily R. Gee. “Health Insurance Issuer Participation and New Entrants in the Health Insurance Marketplace in 2015.” Department of Health and Human Services, Office of the Assistant Secretary for Planning and Evaluation. 23 Sep 2014.
“Premiums Set to Decline Slightly for Benchmark ACA Marketplace Insurance Plans in 2015.” Kaiser Family Foundation. News release. 5 Sep 2014.
“The fee you pay if you don’t have health coverage.” Healthcare.gov. Website accessed 3 Oct 2014.
U.S. Census Bureau, Current Population Survey, Annual Social and Economic Supplements. “Table H-6. Regions–All Races by Median and Mean Income: 1975 to 2013.” 16 Sep 2014.
U.S. Census Bureau, Current Population Survey, Annual Social and Economic Supplements. “Table 2. Poverty Status of People by Family Relationship, Race, and Hispanic Origin: 1959 to 2013.” 16 Sep 2014.
U.S. Department of Agriculture, Food and Nutrition Service. “Supplemental Nutrition Assistance Program (Data as of Sept 5, 2014).” Data extracted 3 Oct 2014.
Bureau of Labor Statistics. “Employment, Hours, and Earnings from the Current Employment Statistics survey (National); Total Nonfarm Employment, Seasonally Adjusted.” Data extracted 3 Oct 2014.
Bureau of Labor Statistics. “Labor Force Statistics from the Current Population Survey; Unemployment Rate, Seasonally Adjusted.” Data extracted 3 Oct 2014.
Bureau of Labor Statistics. “Labor Force Statistics from the Current Population Survey; Number Unemployed for 27 Weeks & Over, Seasonally Adjusted.” Data extracted 3 Oct 2014.
Bureau of Labor Statistics. “Employment, Hours, and Earnings from the Current Employment Statistics survey (National); Average Weekly Earnings of All Employees, 1982-1984 Dollars.” Data extracted 3 Oct 2014.
Bureau of Labor Statistics. “Consumer Price Index – All Urban Consumers.” Data extracted 3 Oct 2014.
Federal Reserve Bank of St Louis. “Corporate Profits After Tax (without IVA and CCAdj) (CP).” Data extracted 3 Oct 2014.
Google Finance. “S&P 500.” Historical prices. Accessed 3 Oct 2014.
Google Finance. “Dow Jones Industrial Average.” Historical prices. Accessed 3 Oct 2014.
Google Finance. “NASDAQ Composite.” Historical prices. Accessed 3 Oct 2014.
U.S. Treasury. “The Debt to the Penny and Who Holds It.” 1 Oct 2014. Data extracted 3 Oct 2014.
Office of Management and Budget. “Table 1.1—Summary of Receipts, Outlays, and Surpluses or Deficits (-): 1789–2019.” Mar 2014.
Office of Management and Budget. “Table S–11. Federal Government Financing and Debt” Fiscal Year 2015 Mid-Session Review, p. 63. 11 Jul 2014.
Congressional Budget Office. “An Update To The Budget And Economic Outlook: 2014 To 2024 — Aug 2014 Baseline.” 27 Aug 2014.
U.S. Bureau of Alcohol, Tobacco, Firearms and Explosives, “Annual Firearms Manufacturing and Export Report; Year 2013 Interim.” 7 Aug 2014. Accessed 3 Oct 2014.
U.S. Bureau of Alcohol, Tobacco, Firearms and Explosives. “Annual Firearms Manufacturing and Export Report; Year 2008.” 8 Mar 2011. Accessed 3 Oct 2014.
National Shooting Sports Foundation. “Gun Industry Sales Reflect a ‘New Normal.’ ” 11 Aug 2014.
U.S. Department of Commerce, Bureau of Economic Affairs. “Table 1. U.S. International Transactions: Exports of Goods and Services.” 18 Jun 2014.
New York Times. The Guantanamo Docket. “A History of the Detainee Population.” 31 May 2014.
U.S. Energy Information Administration. Electric Power Monthly, “Table 1.1.A. Net Generation from Renewable Sources: Total (All Sectors), 2004-July 2014.” 25 Sep 2014.
U.S. Energy Information Administration. “U.S. Crude Oil Production.” Short Term Energy Outlook. 9 Sep 2014. Accessed 3 Oct 2014.
U.S. Energy Information Administration. “Table 3.3a. Monthly Energy Review.” 25 Sep 2014.
iCasualties.org “Operation Enduring Freedom/Afghanistan; Afghanistan Coalition Military Fatalities by Year.” Accessed 3 Oct 2014.
iCasualties.org. “Operation Iraqi Freedom; Iraq Coalition Military Fatalities by Year.” Accessed 3 Oct 2014.