Summary
Since President Barack Obama first took office:
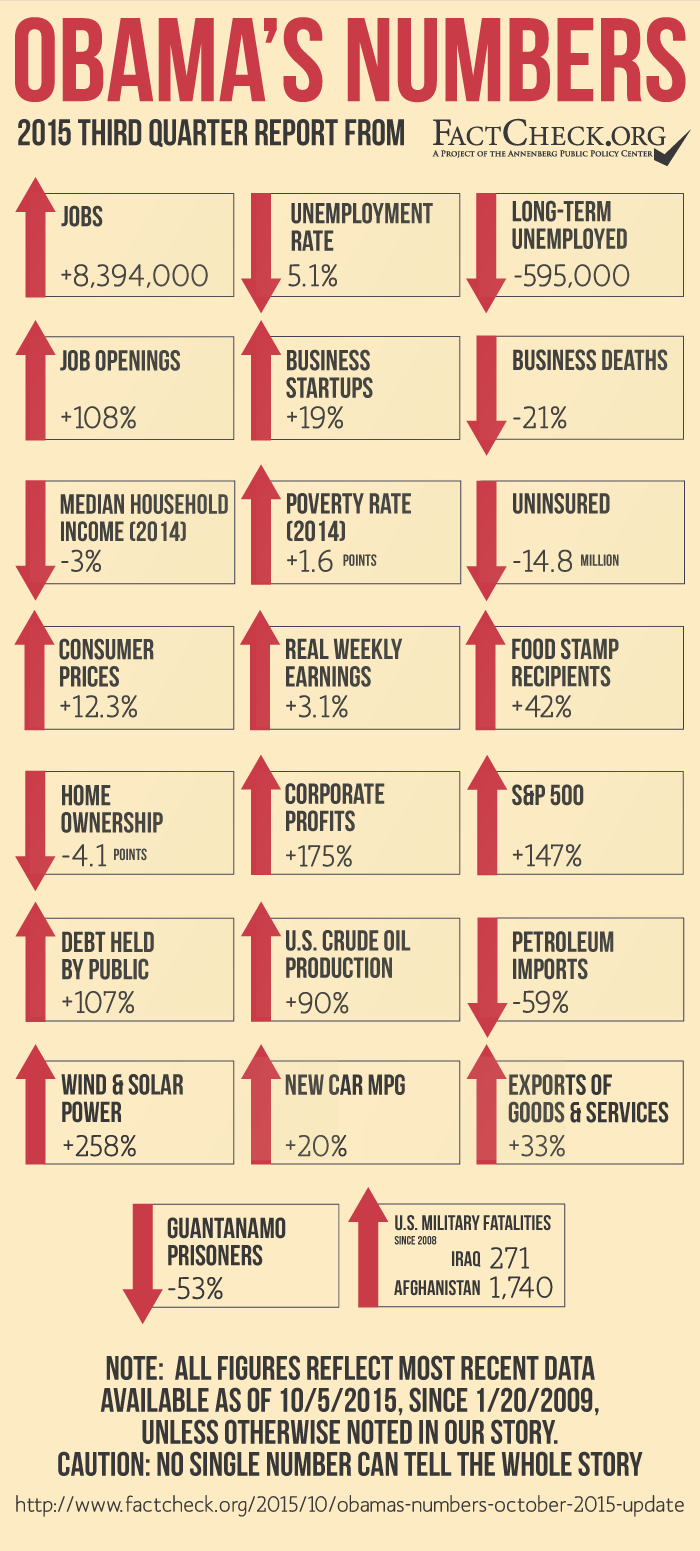
- The economy has added nearly 8.4 million jobs — more than six times the number gained under George W. Bush.
- The number of job openings doubled, to a record 5.7 million.
- Nearly 15 million fewer people lack health insurance coverage.
- Corporate profits are at record levels; stock prices have more than doubled.
- However, median household income was down 3 percent as of 2014, and the official poverty rate was 1.6 percentage points higher.
- The rate of home ownership has dropped to the lowest point in nearly half a century.
- The federal debt owed to the public has more than doubled — up 107 percent.
Analysis
As we do every three months, we offer here a fresh update of selected statistical indicators of what has happened since Barack Obama first took the oath of office in January 2009. We leave it to our readers to judge how much credit or blame the president deserves for what has happened on his watch, and we caution that no single number or collection of numbers can tell the entire story. What we offer here are some key yardsticks from sources we consider solid and reliable.
Jobs & Unemployment
Number of Jobs — The economy has added another 529,000 jobs since our last report three months ago. As of September, the number of total nonfarm jobs stands 8,394,000 higher than when Obama first took office.
To put that into recent historical context, the economy gained nearly 23 million jobs during the booming years of Bill Clinton’s presidency, but fewer than 1.3 million during President George W. Bush’s eight years, which were plagued by two recessions.
Unemployment Rate — Meanwhile the unemployment rate edged down further to 5.1 percent. It’s now 2.7 percentage points lower than it was in January 2009, when the president first took office in the midst of the worst economic downturn since the Great Depression.
Historically, the jobless rate is now better than it has been most of the time since 1948. The historical median is 5.6 percent.
Long-term Unemployment — The number of long-term unemployed — those who have been looking for work for 27 weeks or longer — has continued to inch downward since our last report. The number went down to just over 2.1 million in September, which is 595,000 fewer than when the president first took office.
Job Openings — The number of job openings increased further since our last report, to 5,753,000 as of the last business day in July. That’s the highest number of openings since the Bureau of Labor Statistics began tracking them in December 2000. The number of openings has gone up 108 percent since the month the president entered office.
Business Startups — The growth in the number of new business establishments slowed slightly since our last report. The Bureau of Labor Statistics counted 222,000 “births” of new establishments in the three months ending last December, the most recent period on record. That’s 2,000 fewer than in the previous quarter, but still nearly 19 percent more new establishments than were born in the quarter prior to Obama’s first inauguration.
Meanwhile the number of business establishments shutting down permanently — business “deaths” — has gone down by more than 21 percent. The most recent figure is for the first quarter of 2014, because the BLS must wait a year before counting any shutdown as a permanent closing. Establishment birth and death figures are adjusted to compensate for seasonal variations.
Labor Participation Rate — However, the labor force participation rate, which is the portion of the civilian population that is either employed or currently looking for work, was 62.4 percent in September, down 3.3 percentage points since Obama took office.
Not all of that decline is due to the Great Recession and the slow recovery that followed. The rate actually peaked in early 2000, and it had declined by 1.6 percentage points before Obama took office.
Furthermore, a 2012 article by economists at the Federal Reserve Bank of Chicago concluded that just under half the decline “can be explained by long-running demographic patterns, such as the retirement of baby boomers.” The study predicted that these demographic patterns would continue, and would offset any improvements due to economic recovery in the future.
For more on this, see our March 11 item, “Declining Labor Force Participation Rates.”
Income and Poverty
Also since our last report, the Census has released annual figures on income and poverty covering 2014. They provide a bleak picture of the economic well-being of most Americans during the first six years of Obama’s tenure.
Median household income last year was $53,657, Census reported. In “real” income, adjusted for inflation, that was $1,656 less than in 2008 — a decline of 3 percent. And it was 7.2 percent below the peak year of 1999.
The same Census report showed that the number of people living in poverty went up in 2014 to nearly 46.7 million — which is 6.8 million more than in 2008. The official poverty rate — meaning the percentage of the population living below the official poverty line — was 14.8 percent last year, which is 1.6 percentage points higher than in 2008.
Health Insurance
However, Census also reported that the number of people who lacked health insurance dropped sharply last year, the first year that the main provisions of the Affordable Care Act began to take full effect. According to Census, people who lacked coverage for all of last year declined to 33 million from 41.8 million the previous year — a difference of 8.8 million.
But the most recent Census figures can’t be compared with earlier periods, because Census changed the way it gathers such data in 2013. So to gauge how coverage has changed during Obama’s entire tenure, we turn to the National Health Interview Survey conducted by the Centers for Disease Control and Prevention. Besides keeping a consistent methodology, the NHIS has the added virtue of being conducted quarterly, and so is more up to date than the annual Census figures.
During the three months ending with March of this year, 29 million people lacked coverage at the time they were interviewed, according to the most recent NHIS data (found in Table 1.1a on page 3). That’s down from 43.8 million during all of 2008, a drop of 14.8 million people since Obama first took office.
The recent drop is even more dramatic when considering that the number who lacked coverage jumped up to a peak of 48.6 million in 2010, as many who lost jobs during the recession and its aftermath also lost employer-sponsored coverage for themselves and their family members.
According to the NHIS (Table 1.1b), 14.7 percent of all people in the U.S. lacked health insurance at the time they were interviewed in 2008, and that number peaked at 16 percent in 2010. But it was down to 9.2 percent in the first quarter of 2015.
Prices & Wages
Consumer Prices – Overall inflation in consumer prices has remained moderate over Obama’s more than six-and-a-half years in office, rising by only 12.3 percent between January 2009 and August, the most recent month for which the Bureau of Labor Statistics has released the Consumer Price Index.
The average yearly rise under Obama of 1.9 percent is less than half the post-World War II average, according to BLS figures. Between 1946 and 2008 the average yearly rise in the CPI was 4 percent, measured from December to December. In the most recent 12 months, the CPI has gone up only a little over 0.2 percent.
Real Weekly Earnings – The recent low inflation has helped the buying power of weekly paychecks. The BLS measure of average weekly earnings for all workers, adjusted for inflation and seasonal factors, is 3.1 percent higher in August than it was when Obama first took office.
Gasoline – The national average price of regular gasoline, after rebounding somewhat from the plunge that took it down to just over $2 a gallon in January, is now headed down once again. As of the week ended Sept. 28, it stood at $2.32, according to the U.S. Energy Information Administration.
That’s a 47-cent drop since our last report three months ago. Still, the most recent price is 26 percent higher than the unusually low point at which it stood on Inauguration Day 2009.
Food Stamps
The number of people receiving food stamps dropped slightly since our last report, by fewer than 132,000. And as of June, the most recent month on record, more than 45.5 million Americans were still receiving the food aid, now known as the Supplemental Nutrition Assistance Program.
That’s 4.8 percent lower than the record level set in December 2012, but still 42 percent higher than it was when Obama took office in 2009.
Nevertheless, Obama no longer qualifies for the title of “Food Stamp President” that Republican Newt Gingrich, the former speaker of the House, tried to hang on him during the 2012 presidential campaign. As we noted at the time, 14.7 million people were added to the food-stamp rolls during George W. Bush’s time in office. By comparison, the net gain under Obama now stands at 13.5 million — and it’s slowly declining as the economy improves.
Home Ownership
Since our last report, the rate of home ownership sank again, to the lowest level since 1967.
In the second quarter of this year, the latest Census Bureau figures show, the percentage of households that owned their own home was down to 63.4 percent.
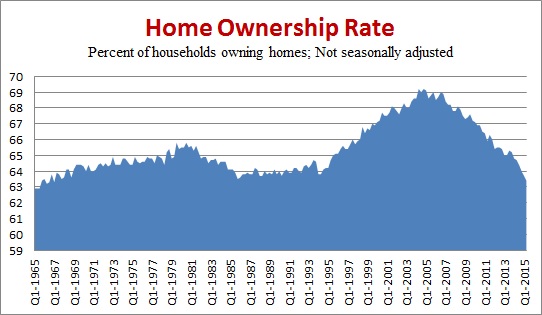 The home ownership rate peaked at 69.2 percent in the second quarter of 2004, but it has declined 5.8 percentage points since then. Most of the decline — 4.1 percentage points — has taken place since Obama first took office.
Technical note: With this update we have switched to using figures that are not adjusted for seasonal variations, in order to put the current trend in a longer historical context. Census has tracked the unadjusted home ownership rate since 1965, but has offered seasonally adjusted figures only since 1980.
Previously we have used the seasonally adjusted rate. That rate smooths out variations due to the time of year. But with home ownership, the seasonal effect is small: On a seasonally adjusted basis, the rate in the second quarter was 63.5 percent, a difference of only 0.1 percentage point from the unadjusted figure of 63.4 percent. The seasonally adjusted rate for the second quarter is the lowest since that series began.
Profits & Markets
Corporate Profits — Corporate profits have soared under Obama, setting record after record. They hit a seasonally adjusted yearly rate of more than $1.8 trillion in the April-June quarter of this year, according to the most recent figures from the U.S. Bureau of Economic Analysis. That exceeds the previous record level set in the third quarter of 2014.
Profits are now running 175 percent higher than in the recession-plagued quarter just before Obama entered office. And they are 31 percent higher than in the best quarter prior to his taking office, which was the third quarter of 2006.
(Technical note: Since our last report, when we reported the gain in after-tax profits at 182 percent, the BEA revised its estimates downward. The revisions are part of an annual fine-tuning of its statistics to make them as accurate as possible. BEA said the revised estimates take advantage of newly available tax-return data from the Internal Revenue Service, and updated measures of seasonal variation.)
Stock Markets – Stock prices have declined sharply since our last report. Nevertheless, stockholders have done quite well under Obama. The Standard & Poor’s 500-stock index was 147 percent higher at the close on Oct. 5 than it was the day Obama took office. Other stock indexes show similarly robust gains. The Dow Jones Industrial Average has also more than doubled, rising 111 percent during Obama’s tenure, and the NASDAQ Composite index has tripled, rising 232 percent.
Federal Debt, Deficits and Spending
The debt owed to the public has more than doubled. It is now nearly $13.1 trillion, an increase of 107 percent since Obama first took office.
And the debt also has grown dramatically even when measured as a percentage of the growing economy, from 52 percent of gross domestic product at the end of fiscal year 2009 to just under 74 percent last year.
Federal spending, however, has increased much less. Total federal outlays in the fiscal year that just ended will total around $3.67 trillion, according to the most recent CBO estimate. That’s just 4.5 percent above the total outlays for fiscal 2009, which was well underway when Obama took office.
As we’ve shown in detail elsewhere, Obama’s early spending initiatives added — at most — $203 billion to the fiscal year 2009 spending levels that were set before he took office. Attributing that extra FY 2009 spending to Obama brings the total increase in outlays since he took office to just under 11 percent over the level he inherited.
Massive federal deficits continue: The final figure for the fiscal year that ended Sept. 30 hasn’t yet been tallied, but last month’s Monthly Budget Review by the nonpartisan Congressional Budget Office estimated that the deficit would come in at $426 billion, about $59 billion less than the shortfall in fiscal year 2014. However, the debt is now growing less rapidly than during Obama’s first years, which saw a string of trillion-dollar-plus annual deficits.
Total debt, counting money the government owes to itself, currently stands at close to $18.2 trillion, up nearly 71 percent under Obama.
Energy
U.S. Crude Oil Production – U.S. crude oil production has nearly doubled under Obama, but the historic boom may finally have peaked, at least for a while.
In September, the Energy Information Administration reported in its monthly Short Term Energy Outlook that total U.S. crude oil production began declining in May, and was expected to continue falling in coming months. A plunge in the price of crude oil — from more than $100 a barrel last year to $44.40 last week — has led to less drilling and fewer new oil wells being completed, EIA said.
Nevertheless, in the second quarter of this year, the U.S. produced 90 percent more crude oil than it did in the three months before Obama began his presidency. (Since our last report, when we put the increase at 94 percent, EIA has revised this year’s production estimates downward a bit, based on new survey data.)
Also, EIA said it expected U.S. production to begin rising again in August of next year, when a dozen projects in the Gulf of Mexico are projected to come on line.
Oil Imports & Dependency — With the increase in domestic production, U.S. reliance on imported oil has been cut by more than half. Under Obama, as of the second quarter of 2015, net imports were down 59 percent.
And as a result, during the first eight months of this year, the U.S. imported only 25.3 percent of the petroleum and refined products that it consumed. For all of 2014, the figure was 26.5 percent, the lowest annual level of dependency on imports since before the first Arab oil embargo of 1973-74.
The U.S. oil boom is due mainly to advances in drilling technology rather than to any change in government policy. The decline in dependency on imports actually began in 2006, after peaking at 60.3 percent the year before. But the trend has continued under Obama.
Wind & Solar – Electricity generated by wind and solar power in the most recent 12 months on record (ending in July) was 258 percent higher than the total for 2008.
The increase in solar power in particular has been spectacular. The U.S. generated 27 times more electricity from solar power in the most recent 12 months than it did in the year before Obama took office.
These trends are partly due to large federal tax subsidies for wind and solar generation, all supported by Obama. But several states, independent of federal policy, also have imposed renewable energy standards that require electric utilities to generate a certain portion of their power from wind or solar. Market forces also have been at work: The cost of installing a solar system has dropped 73 percent since 2006, according to the Solar Energy Industries Association.
The U.S. produced 4.9 percent of all its electricity from wind and solar in the most recent 12 months on record, up from 1.4 percent in 2008. But coal still accounted for the biggest share — 36 percent — followed by natural gas at 30 percent and nuclear power at 20 percent.
Unfulfilled Promises
Exports – Exports rose weakly since our last report, but still remain far short of the president’s 2010 promise to “double our exports over the next five years.” The clock ran out on that goal at the end of last year.
As of the second quarter of this year, according to the most recent quarterly report of the Commerce Department’s Bureau of Economic Analysis, U.S. exports of goods and services have gone up by only 32.5 percent since Obama took office.
Future prospects look bleak: The Wall Street Journal reported Sept. 29 that hopes for an export boom “are wilting under the weight of a strong dollar and global economic strains.” The Journal reported, based on monthly “advance” figures from the BEA, that exports for 2015 are on track to be lower than they were in 2014.
Car Mileage — Progress toward Obama’s goal of doubling the fuel efficiency of new cars and light trucks by 2025 has come to a standstill.
The average EPA city/highway sticker mileage of light duty vehicles sold in September was 25.2 miles per gallon, according to the Transportation Research Institute of the University of Michigan. That’s actually 0.2 mpg lower than the June figure we cited in our last report, and 0.1 mpg lower than it was in September of last year. For the entire 2015 model year (vehicles sold in the 12 months ending in September), the sticker mileage was exactly the same as for model year 2014.
The September figure is 20 percent higher than it was when Obama first took office — but that’s a long way short of the president’s 2013 boast that “we have doubled the distance our cars will go on a gallon of gas.” What he meant was that the administration was putting in place requirements that cars and light trucks average 54.5 mpg by model year 2025. But recently, lowered gasoline prices have led car buyers to temper their enthusiasm for smaller, more efficient cars and trucks.
So it is looking increasingly doubtful that Obama’s ambitious goal can be reached on schedule. The industry is reported to be readying a push to relax the standards when they come up for review in 2017.
Guantanamo – Since our last report, two more prisoners have been released from the military detention camp for suspected terrorists in Guantanamo Bay, Cuba — one was announced on Sept. 17 and another on Sept. 22. But 114 remain at the facility, which Obama ordered to be closed within a year just after taking office. In the more than six-and-a-half years since then, the population has been reduced by 53 percent.
War Deaths
Since our last report, one U.S. sailor died of a noncombat gunshot (reportedly a possible suicide) while serving in support of “Operation Inherent Resolve” against Islamic State forces in Iraq and elsewhere. That brings the total U.S. military fatalities in Iraq operations since Obama took office to 271.
Meanwhile, 10 more have died supporting continuing U.S. operations in Afghanistan — including six airmen who died in the Oct. 2 crash of a C-130 transport plane at Jalalabad Airfield, Afghanistan. Those brought the total there to 1,740 since Obama became commander in chief.
— Brooks Jackson
Sources
Bureau of Labor Statistics. “Employment, Hours, and Earnings from the Current Employment Statistics survey (National); Total Nonfarm Employment, Seasonally Adjusted.” Data extracted 5 Oct 2015.
Bureau of Labor Statistics. “Labor Force Statistics from the Current Population Survey; Unemployment Rate, Seasonally Adjusted.” Data extracted Data extracted 5 Oct 2015.
Bureau of Labor Statistics. “Labor Force Statistics from the Current Population Survey; Number Unemployed for 27 Weeks & Over, Seasonally Adjusted.” Data extracted 5 Oct 2015.
Bureau of Labor Statistics. “Job Openings and Labor Turnover Survey: Job Openings, Seasonally Adjusted.” Data extracted 5 Oct 2015.
Bureau of Labor Statistics. “Private sector establishment births and deaths, seasonally adjusted.” 29 Jul 2015.
Bureau of Labor Statistics. “Labor Force Statistics from the Current Population Survey; Labor Force Participation Rate.” Data extracted 5 Oct 2015.
Aaronson, Daniel and Jonathan Davis and Luojia Hu. “Explaining the Decline in the U.S. Labor Force Participation Rate.” Chicago Fed Letter, Federal Reserve Bank of Chicago. Mar 2012.
U.S. Census Bureau. “Income, Poverty and Health Insurance Coverage in the United States: 2014.” 16 Sep 2015.
Smith, Jessica C. and Carla Medalia. “Health Insurance Coverage in the United States; 2014.” 16 Sep 2015.
Centers for Disease Control and Prevention; National Health Interview Survey. “Early Release of Selected Estimates Based on Data From the National Health Interview Survey, January – March 2015.” Sep 2015.
Bureau of Labor Statistics. “Consumer Price Index – All Urban Consumers.” Data extracted Data extracted 5 Oct 2015.
Bureau of Labor Statistics. “Employment, Hours, and Earnings from the Current Employment Statistics survey (National); Average Weekly Earnings of All Employees, 1982-1984 Dollars.” Data extracted 5 Oct 2015.
U.S. Energy Information Administration. “Weekly U.S. Regular All Formulations Retail Gasoline Prices (Dollars per Gallon).” Data extracted 5 Oct 2015.
U.S. Department of Agriculture, Food and Nutrition Service. “Supplemental Nutrition Assistance Program (Data as of Sept 4, 2015).” Data extracted 5 Oct 2015.
U.S. Census Bureau.”Residential Vacancies and Homeownership in the Second Quarter 2015.” 28 Jul 2015.
U.S. Census Bureau. “Time Series: Not Seasonally Adjusted Home Ownership Rate.” Data extracted 5 Oct 2015.
Federal Reserve Bank of St Louis. “Corporate Profits After Tax (without IVA and CCAdj) (CP).” Data extracted 5 Oct 2015.
McCulla, Stephanie H. and Shelly Smith. “The 2015 Annual Revision of the National Income and Product
Accounts.” Survey of Current Business, Bureau of Economic Analysis, U.S. Department of Commerce. Aug 2015.
Google Finance. “S&P 500.” Historical prices. Data extracted 2 Oct 2015.
Google Finance. “Dow Jones Industrial Average.” Historical prices. Data extracted 2 Oct 2015.
Google Finance. “NASDAQ Composite.” Historical prices. Data extracted 2 Oct 2015.
U.S. Treasury. “The Debt to the Penny and Who Holds It.” 1 Oct 2015. Data extracted 5 Oct 2015.
Congressional Budget Office. “Monthly Budget Review for August 2015.” 8 Sep 2015.
U.S. Energy Information Administration. “Short Term Energy Outlook.” Sep 2015.
U.S. Energy Information Administration. “Cushing, OK WTI Spot Price FOB (Dollars per Barrel).” 30 Sep 2015.
U.S. Energy Information Administration. “U.S. Crude Oil Production.” Short Term Energy Outlook. 9 Sep 2015. Data extracted 5 Oct 2015.
U.S. Energy Information Administration. “Table 3.3a. Monthly Energy Review.” 25 Sep 2015.
U.S. Energy Information Administration. Electric Power Monthly, “Table 1.1.A. Net Generation from Renewable Sources: Total (All Sectors), 2005-January 2015.” 24 Sep 2015.
U.S. Department of Commerce, Bureau of Economic Affairs. “Table 1. U.S. International Transactions: Exports of Goods and Services.” 17 Sep 2015.
Sivak, Michael and Brandon Schoettle. “Average sales-weighted fuel-economy rating (window sticker) of purchased new vehicles for October 2007 through March 2015.” University of Michigan Transportation Research Institute. 2 Oct 2015
New York Times. The Guantanamo Docket. “A History of the Detainee Population.” 24 Sep 2015.
iCasualties.org. “Operation Enduring Freedom/Afghanistan; Afghanistan Coalition Military Fatalities by Year.” Data extracted 5 Oct 2015.
iCasualties.org. “Operation Iraqi Freedom; Iraq Coalition Military Fatalities by Year.” Data extracted 5 Oct 2015.