Summary
Since President Barack Obama first took office:
- Homicides have dropped 13 percent, but gun sales have surged.
- The economy has added more than 9 million jobs, and the jobless rate has dropped to below the historical median.
- The number of long-term unemployed Americans has dropped by 614,000 under Obama, but it is still 761,000 higher than at the start of the Great Recession.
- Corporate profits are up 166 percent; real weekly wages are up 3.4 percent.
- There are 15 million fewer people who lack health insurance.
- Wind and solar power have nearly tripled, and now account for more than 5 percent of U.S. electricity.
- The federal debt has more than doubled — rising 116 percent — and big annual deficits have continued.
Those are just some of our findings in our latest installment of Obama’s Numbers.

Analysis
As we do every three months, we offer here a fresh update of selected statistical indicators of what has happened since Barack Obama first took the oath of office in January 2009. We leave it to our readers to judge how much credit or blame the president deserves for what has happened on his watch, and we caution that no single number or collection of numbers can tell the entire story. What we offer here are some key yardsticks from sources we consider solid and reliable.
Crime & Guns
Since recent mass shootings have dominated the headlines and the national political debate, we start with subjects we haven’t often explored in past updates: homicides and guns.
Violent Crime — Homicides and other violent crime have decreased markedly since Obama took office.
According to the FBI’s most recent annual compilation of crime reports published Dec. 14, there were 2,216 fewer murders and deaths from nonnegligent manslaughter in the U.S. during 2014 than in 2008, the year before Obama first took office. That’s a 13 percent reduction in the number of homicides.
The drop in all violent crime — including homicide, rape, robbery and aggravated assault — is even greater. There were 229,078 fewer violent crimes in the U.S. in 2014 than in 2008, a drop of 16 percent, according to the FBI.
And because the U.S. population was growing, the violent crime rate dropped even faster than the absolute numbers. In 2014, the homicide rate was 4.5 per 100,000 inhabitants, down from 5.4 in 2008.
News reports suggest that the homicide trend may have reversed last year, at least in several large cities where spikes in murder rates had been reported as of mid-2015. The national picture for the full year will have to wait until the FBI’s next annual release of comprehensive statistics, however.
Guns — Although Obama campaigned on a promise to reimpose the expired “assault weapons ban,” that has not been accomplished, and his tenure has actually been marked by a remarkable rise in the sale and ownership of firearms.
In 2015, the number of criminal background checks of potential gun buyers hit more than 14.2 million, as measured by the National Shooting Sports Foundation’s adjusted figures. That was 58 percent higher than in 2008.
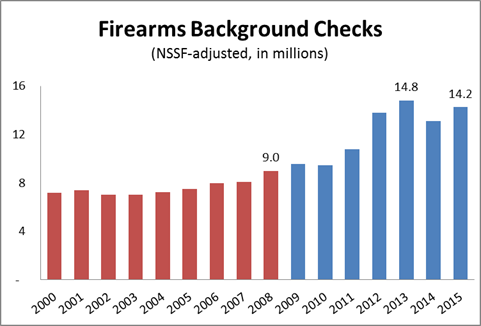
The number hit a record of nearly 14.8 million in 2013 — which was an increase of 65 percent over 2008.
The NSSF figures are the closest approximation we have to current sales figures. The NSSF adjusts the FBI’s monthly statistics to remove background checks requested for concealed-carry permits, which are not related to sales. However, not all background checks are followed by a sale, and an unknown number of private sales take place without any requirement for a background check.
The figures cover all kinds of firearms, including handguns, rifles and shotguns.
Jobs & Unemployment
Number of Jobs — The economy has added 851,000 jobs since we published our last report. As of December, the number of total nonfarm jobs stands 9,265,000 higher than when Obama first took office.
That compares with the nearly 23 million jobs gained during the booming years of Bill Clinton’s presidency, and the fewer than 1.3 million added during President George W. Bush’s eight years, which were plagued by two recessions.
Unemployment Rate — Meanwhile the unemployment rate went down again, to 5.0 percent. It’s now 2.8 percentage points lower than it was in January 2009, when the president first took office in the midst of the worst economic downturn since the Great Depression.
Historically, the jobless rate is significantly lower than it has been most of the time since 1948. The historical median is 5.6 percent.
Long-term Unemployment — The number of long-term unemployed — those who have been looking for work for 27 weeks or longer — has dropped further since our last report. The number went down to less than 2.1 million in December, which is 614,000 fewer than when the president first took office. But it is still 761,000 higher than it was in December 2007, at the start of the Great Recession.
Labor Participation Rate — The labor force participation rate, which is the portion of the civilian population that is either employed or currently looking for work, ticked upward since our last report, to 62.6 percent in December. But it is still 3.1 percentage points lower than when Obama took office.
Contrary to many of Obama’s critics, however, that decline is due mostly to factors outside the control of any president — factors such as the post-World War II baby boomers reaching retirement age. Survey data published by the Bureau of Labor Statistics in December show that those outside the labor force in 2014 said their reasons for not working were retirement (44 percent), illness or disability (19 percent), school attendance (18 percent) or home responsibilities (15 percent). Only 3 percent said they couldn’t find a job, or gave some other reason.
Job Openings — The number of job openings has declined only slightly since our last report, when it had peaked at the highest level in the 15 years that the Bureau of Labor Statistics has been tracking it.
The latest figures from the BLS show there were 5,431,000 jobs open in November, down 4 percent from the revised peak figure recorded in July, but still up 97 percent over the month Obama took office. The number of job openings now has exceeded 5 million for 10 consecutive months, after being below 5 million every month since January 2001.
Profits & Markets
Corporate Profits — Corporate profits have soared under Obama. After-tax profits were running at an annual rate of just under $1.8 trillion in the July-October quarter of last year, the most recent figures available. That’s down somewhat from the previous quarter — which was a record. But still 166 percent higher than in the quarter just before Obama entered office.
That quarter’s profits were unusually low, ravaged by the Great Recession. But even compared with the best quarter prior to his taking office, which was the third quarter of 2006, after-tax profits are up 27 percent.
Stock Markets – Stock prices have declined sharply since our last report. The first week of 2016 was the worst opening to a new year on record.
But despite recent losses, stockholders have done quite well under Obama. The Standard & Poor’s 500-stock index was 139 percent higher at the close on Jan. 11 than it was the day Obama took office. Other stock indexes show similarly robust gains. The Dow Jones Industrial Average has also more than doubled, rising 106 percent during Obama’s tenure, and the NASDAQ Composite index has tripled, rising 222 percent.
Prices & Wages
Consumer Prices – Overall inflation in consumer prices has remained moderate over Obama’s more than six-and-a-half years in office, rising by only 12.4 percent between January 2009 and November, the most recent month for which the Bureau of Labor Statistics has released the Consumer Price Index.
The average yearly rise under Obama of 1.9 percent is less than half the post-World War II average, according to BLS figures. Between 1946 and 2008 the average yearly rise in the CPI was 4 percent, measured from December to December. In the most recent 12 months, the CPI has gone up only a little more than 0.2 percent.
Gasoline – The national average price of regular gasoline sank to just under $2 a gallon last week ($1.996), according to the U.S. Energy Information Administration. That’s a 32-cent drop since our last report, and the lowest point since March 2009.
The most recent average is only 8 percent above the abnormally low point at which it stood on Inauguration Day 2009, when demand was suppressed by a worldwide recession.
Real Weekly Earnings – The recent low inflation has helped the buying power of weekly paychecks. The BLS measure of average weekly earnings for all workers, adjusted for inflation and seasonal factors, is 3.4 percent higher in November than it was when Obama first took office.
(Note: This figure may be revised slightly in our next report. The BLS is currently recalculating figures for January 2009 and for several earlier months, after discovering a data processing error. For this report we are still using as our starting point the figure that BLS originally published. The revised figure won’t be available until Feb. 5.)
Food Stamps
The number of people receiving food stamps dropped again since our last report, by nearly 142,000. As of October, the most recent month on record, nearly 45.4 million Americans were still receiving the food aid, now known as the Supplemental Nutrition Assistance Program.
That’s 5.1 percent lower than the record level set in December 2012, but still nearly 42 percent higher than it was when Obama took office in 2009.
But as we noted when Republicans called Obama the “Food Stamp President,” 14.7 million people were added to the food-stamp rolls during George W. Bush’s time in office. By comparison, the net gain under Obama now stands at just under 13.4 million — and it’s slowly declining as the economy improves.
Health Insurance
The number of people lacking health insurance continued to decline since our last report, according to the most recent data from the National Health Interview Survey conducted by the Centers for Disease Control and Prevention.
During the first six months of 2015, about 28.5 million people of all ages reported being without coverage at the time they were interviewed, the CDC reported in its most recent quarterly report. That’s down from 43.8 million during all of 2008 (see Table 1.1a), a drop of 15.3 million people since Obama first took office.
As a percentage of all U.S. residents, the uninsured have dropped to 9 percent of the population in the first half of last year, from 14.7 percent in 2008.
Home Ownership
The home ownership rate ticked upward since our last report, with 63.7 percent of households owning their own home in the third quarter of 2015, according to the latest Census Bureau figures.
That’s 0.3 percentage points higher than the previous quarter, when the rate hit the lowest point in more than half a century. But that gain may be illusory — due to normal seasonal variations. And it is still 3.8 percentage points lower than it was when Obama first took office.
Using seasonally adjusted figures, the rate was unchanged from the previous quarter, and still the lowest since Census began issuing such figures in 1980.
The unadjusted rate peaked at 69.2 percent in the second quarter of 2004, and has declined 5.5 percentage points since then. Most of the decline has taken place since Obama first took office.
Energy
U.S. Crude Oil Production – Despite recent declines, U.S. crude oil production has nearly doubled under Obama.
A plunge in the price of crude oil — from more than $100 a barrel last year to $36.81 last week — has led to less drilling and fewer new oil wells being completed, and to a decline in U.S. production in recent months.
Nevertheless, in the fourth quarter of last year, the U.S. produced 87 percent more crude oil than it did in the three months before Obama began his presidency.
Oil Imports & Dependency — Meanwhile, U.S. reliance on imported oil has been cut by more than half. Under Obama, as of the fourth quarter of 2015, net imports were down 62 percent.
And in the first 11 months of last year, the U.S. imported only 24.3 percent of the petroleum and refined products that it consumed. That’s the lowest annual level of dependency on imports since before the first Arab oil embargo of 1973.
The U.S. oil boom is due mainly to advances in drilling technology rather than to any change in government policy. The decline in dependency on imports actually began in 2006, after peaking at 60.3 percent the year before. But the trend has continued under Obama.
Wind & Solar – Electricity generated by large-scale wind and solar power in the most recent 12 months on record (ending in October) was 273 percent higher than the total for 2008.
The increase in solar power in particular has been spectacular. The U.S. generated 29 times more electricity from solar power in the most recent 12 months than it did in the year before Obama took office. However, wind and solar still accounted for only 5.1 percent of total large-scale generation in the most recent 12 months, up from 1.4 percent in 2008.
That actually understates the change to some degree. We have used only the EIA’s figures for “utility scale” electric generation. But in 2014, EIA also began tracking small-scale (under 1 megawatt) “distributed” solar voltaic generation, such as the power produced by rooftop systems installed by homeowners. Wind and solar now account for 5.9 percent of the combined total of utility-scale power and “distributed” solar power.
Federal Debt, Deficits and Spending
Debt – The U.S. government’s debt owed to the public has more than doubled. It is now more than $13.6 trillion, an increase of 116 percent since Obama first took office.
And the debt also has grown dramatically even when measured as a percentage of the growing economy, from 52 percent of gross domestic product at the end of fiscal year 2009 to just under 74 percent at the end of fiscal 2015, according to the most recent estimate by the nonpartisan Congressional Budget Office.
Spending – Federal spending, however, has increased much less. Total federal outlays in the fiscal year that ended Sept. 30 last year totaled just under $3.69 trillion, according to final U.S. Treasury figures. That’s just 4.8 percent above the total outlays for fiscal 2009, which was well underway when Obama took office.
To be sure, Obama was responsible for some of the FY 2009 spending, but as we’ve shown in detail elsewhere, his early spending initiatives added — at most — $203 billion to the fiscal year 2009 spending levels that were set before he took office. Even attributing that extra FY 2009 spending to Obama brings the total increase in outlays since he took office to 11.3 percent over the level he inherited.
Massive federal deficits continue: The final figure for FY 2015 was $438.9 billion. That was about $44.5 billion less than the shortfall in fiscal year 2014, but CBO projects that without further spending cuts or revenue increases, deficits will soon be growing larger again, and will top $1 trillion in FY 2025.
Total debt, counting money the government owes to itself, currently stands at nearly $18.9 trillion, up nearly 78 percent under Obama.
Unfulfilled Promises
Exports – Exports have slid since our last report, leaving them even further short of a promise Obama made in his 2010 State of the Union address to “double our exports over the next five years.” The clock ran out on that goal at the end of 2014.
As of the third quarter of this year, according to the most recent quarterly report of the Commerce Department’s Bureau of Economic Analysis, U.S. exports of goods and services have gone up by only 31.2 percent since Obama took office.
Furthermore, third-quarter exports were 5.1 percent lower than the same quarter in 2014.
Car Mileage — Progress has also gone into reverse when it comes to Obama’s goal of doubling the fuel efficiency of new cars and light trucks by 2025.
The average EPA city/highway sticker mileage of light duty vehicles sold in December was 24.9 miles per gallon, according to the Transportation Research Institute of the University of Michigan. That’s 0.3 lower than the September figure we cited in our last report. It is down 0.9 mpg since peaking in August 2014.
The president boasted in 2013 that “we have doubled the distance our cars will go on a gallon of gas.” What he meant was that the administration was putting in place government requirements that cars and light trucks average 54.5 mpg by model year 2025. But falling gasoline prices have given consumers other ideas. Sales of big pickup trucks are up; sales of thriftier vehicles such as the Honda Accord, Ford Fusion and Chevrolet Cruz are down.
Even with the recent backsliding, new car mpg was 19 percent higher in December than it was in the month that Obama took office.
Guantanamo – Since our last report, 11 more prisoners have been released from the military detention camp for suspected terrorists in Guantanamo Bay, Cuba. But 103 remain at the facility, which Obama ordered to be closed within a year just after taking office. In the more than six-and-a-half years since then, the population has been reduced by 57 percent.
More are expected to be released soon. The president said in a December 18 news conference that he expects the number to drop below 100 by early in 2016. “And we will continue to steadily chip away at the numbers in Guantanamo,” he added.
War Deaths
Since our last report, another nine U.S. service members have died supporting continuing U.S. operations in Afghanistan, including six killed by a suicide bomb attack Dec. 21 and two who died in a helicopter crash in October. In addition, an Army staff sergeant was killed earlier this year in fighting near the city of Marjah, in Afghanistan’s southern Helmand province.
Those bring the total killed in the Afghan conflict to 1,749 since Obama took office.
Two more also have died in the Iraq conflict: An Army sergeant killed in October during a mission to rescue Islamic State prisoners near the town of Hawija, and an Army private killed in what officials described as a non-combat incident at the Al Asad Air Base.
Those deaths bring the Iraq total to 273 since Obama became commander in chief.
Sources
Federal Bureau of Investigation. “Crime in the United States 2014.” Table 1. 28 Sep 2015.
Federal Bureau of Investigation. “NICS Firearm Background Checks Month/Year by State/Type.” Data extracted 12 Jan 2016.
Davey, Monica and Mitch Smith. “Murder Rates Rising Sharply in Many U.S. Cities.” New York Times. 31 Aug 2015.
Bureau of Labor Statistics. “Employment, Hours, and Earnings from the Current Employment Statistics survey (National); Total Nonfarm Employment, Seasonally Adjusted.” Data extracted 12 Jan 2016.
Bureau of Labor Statistics. “Labor Force Statistics from the Current Population Survey; Unemployment Rate, Seasonally Adjusted.” Data extracted 12 Jan 2016.
Bureau of Labor Statistics. “Labor Force Statistics from the Current Population Survey; Number Unemployed for 27 Weeks & Over, Seasonally Adjusted.” Data extracted 12 Jan 2016.
Bureau of Labor Statistics. “Job Openings and Labor Turnover Survey: Job Openings, Seasonally Adjusted.” Data extracted 12 Jan 2016.
Bureau of Labor Statistics. “Labor Force Statistics from the Current Population Survey; Labor Force Participation Rate.” Data extracted 12 Jan 2016.
Federal Reserve Bank of St Louis. “Corporate Profits After Tax (without IVA and CCAdj) (CP).” Data extracted 12 Jan 2016.
Shell, Adam. “Stocks close out week with worst start to year ever.” USA Today. 9 Jan 2016.
Google Finance. “S&P 500.” Historical prices. Data extracted 12 Jan 2016.
Google Finance. “Dow Jones Industrial Average.” Historical prices. Data extracted 12 Jan 2016.
Google Finance. “NASDAQ Composite.” Historical prices. Data extracted 12 Jan 2016.
Bureau of Labor Statistics. “Consumer Price Index – All Urban Consumers.” Data extracted 12 Jan 2016.
U.S. Energy Information Administration. “Weekly U.S. Regular All Formulations Retail Gasoline Prices (Dollars per Gallon).” Data extracted 12 Jan 2016.
Bureau of Labor Statistics. “Employment, Hours, and Earnings from the Current Employment Statistics survey (National); Average Weekly Earnings of All Employees, 1982-1984 Dollars.” Data extracted 12 Jan 2016.
U.S. Department of Agriculture, Food and Nutrition Service. “Supplemental Nutrition Assistance Program (Data as of Jan. 8, 2016).” Data extracted 12 Jan 2016.
Centers for Disease Control and Prevention; National Health Interview Survey. “Health Insurance Coverage: Early Release of Estimates From the National Health Interview Survey, January–June 2015.” Nov 2015.
U.S. Census Bureau. “Time Series: Not Seasonally Adjusted Home Ownership Rate.” Data extracted 12 Jan 2016.
U.S. Energy Information Administration. “U.S. Crude Oil Production.” Short Term Energy Outlook. 12 Jan 2016. Data extracted 12 Jan 2016.
U.S. Energy Information Administration. “Table 3.3a. Monthly Energy Review.” 23 Dec 2015.
U.S. Energy Information Administration. Electric Power Monthly, “Table 1.1.A. Net Generation from Renewable Sources: Total (All Sectors), 2005-January 2015.” Electric Power Monthly. 24 Dec 2015.
U.S. Department of Commerce, Bureau of Economic Affairs. “Table 1. U.S. International Transactions: Exports of Goods and Services.” 17 Dec 2015.
U.S. Treasury. “The Debt to the Penny and Who Holds It.” 8 Jan 2016. Data extracted 12 Jan 2016.
U.S. Treasury. “Final Monthly Treasury Statement of Receipts and Outlays of the United States Government for Fiscal Year 2015.” Oct 2015.
Office of Management and Budget. “Table 1.1—Summary of Receipts, Outlays, and Surpluses or Deficits (-): 1789–2020.” Mar 2015.
Congressional Budget Office. “Monthly Budget Review for August 2015.” 8 Sep 2015.
U.S. Department of Commerce, Bureau of Economic Affairs. “Table 1. U.S. International Transactions: Exports of Goods and Services.” 17 Dec 2015.
Sivak, Michael and Brandon Schoettle. “Average sales-weighted fuel-economy rating (window sticker) of purchased new vehicles for October 2007 through December 2015.” University of Michigan Transportation Research Institute. 6 Jan 2015.
New York Times. The Guantanamo Docket. “A History of the Detainee Population.” 11 Jan 2016.
iCasualties.org. “Operation Enduring Freedom/Afghanistan; Afghanistan Coalition Military Fatalities by Year.” Data extracted 12 Jan 2016.
iCasualties.org. “Operation Iraqi Freedom; Iraq Coalition Military Fatalities by Year.” Data extracted 12 Jan 2016.