Summary
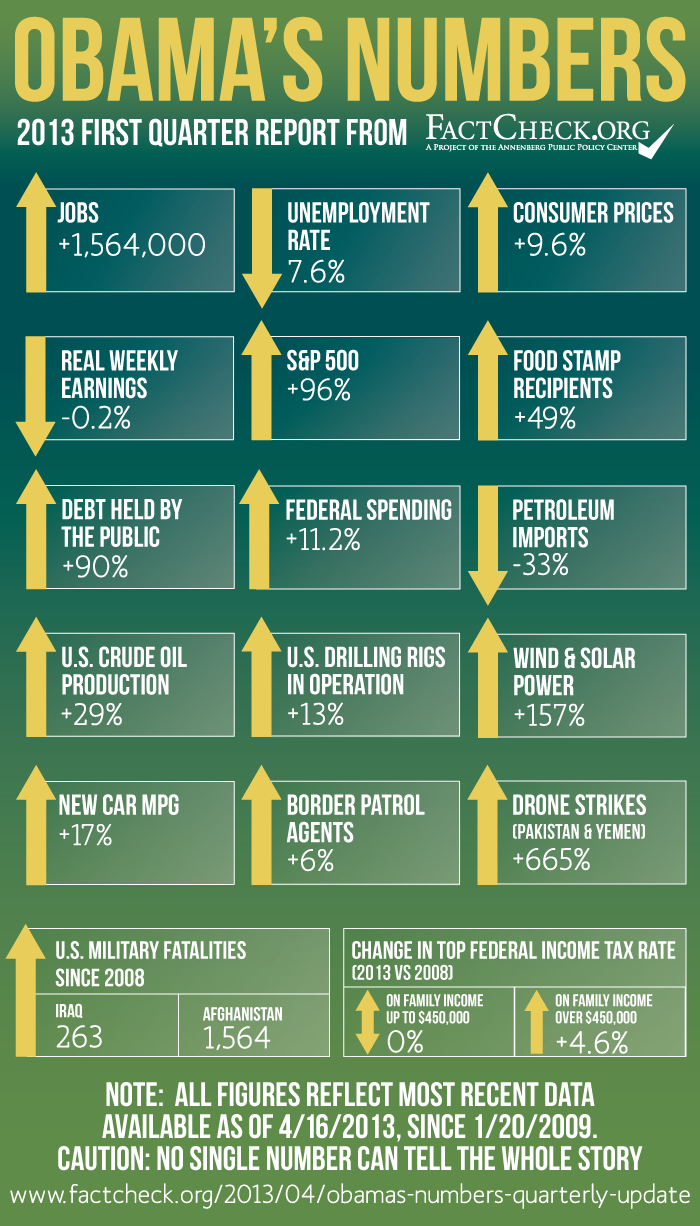
Reviewing some key statistical measures of Barack Obama’s presidency so far, we find:
- The economy has added more jobs since Obama took office than it did in his predecessor’s entire eight years in office.
- Despite the improved economy, the number of people receiving food-stamp assistance has continued to grow, and now more people have been added to the food-stamp rolls under Obama than under any single previous president.
- Federal spending under Obama has grown faster than inflation, but far more slowly than it did under President Bush.
- Federal debt held by the public has grown by 90 percent since Obama took office.
- Obama has ordered seven times more drone strikes than Bush in the covert conflicts in Pakistan and Yemen, according to independent estimates.
- Domestic oil production has soared; oil imports have dropped by one-third; new cars are getting 17 percent better mileage; and wind and solar power have increased 157 percent.
These are some of the insights that emerge from the first in a series of regular quarterly updates of key statistical indicators of the Obama presidency.
As with our “Obama’s Numbers” article in October, and the pre-election update we posted Nov. 5, our intent is to provide accurate measures of what’s changed — for better or worse — since Obama first took office in January 2009.
Analysis
Jobs: Obama Beats Bush
Now that we have figures for the full four years of Obama’s first term, a surprising fact emerges: The economy added more jobs during four years under Obama than it did in the entire eight years under Bush.
By the time of Obama’s second inaugural in January, the economy had added a net total of 1,208,000 jobs since he was first sworn in four years earlier, according to current figures from the Bureau of Labor Statistics. That beats George W. Bush’s eight-year total of 1,083,000.
And so far, Obama is extending his lead over Bush. Counting jobs added in February, his total now stands at a net gain of over 1.5 million jobs.
Neither president’s record is good by historical standards, especially when compared with the 22.8 million jobs added during Bill Clinton’s eight years in office. The Bush years were hampered by a recession and prolonged job slump that began within weeks of his taking office in 2001, and later by the devastating recession of 2007-2009.
The economy lost 8.7 million jobs as a result of the 2007-2009 recession, the worst since the Great Depression of the 1930s. Those losses included 4.4 million jobs lost during Bush’s final year, and another 4.3 million during Obama’s first 13 months in office. But since then, all the jobs initially lost under Obama have been regained, plus another 1,564,000.
A note of caution: Figures are subject to later revision as the Bureau of Labor Statistics continues to refine them. Job gains under Obama turned out to be somewhat larger than reported initially after the BLS completed its annual “benchmark” corrections, for example. Also, figures for February and March are still “preliminary” and could be revised — up or down — when the April figures are released in May.
Unemployment Rate: Still High
Despite the job gains, the unemployment rate remains high by historical standards. It was 7.6 percent in March, which is 0.2 percentage points lower than when Obama took office in 2009. But it was still well above the 5.3 percent average monthly unemployment rate during the Bush years, or the under 5.2 percent average for the years when Bill Clinton was president.
Worse, economists expect the jobless rate to remain high for years to come. The nonpartisan Congressional Budget Office, for one, predicts that the rate will remain above 7.5 percent through next year. “If that happens, 2014 will be the sixth consecutive year with unemployment exceeding 7-½ percent of the labor force — the longest such period in the past 70 years,” CBO Director Douglas Elmendorf stated in Senate testimony Feb. 25.
Modest Inflation, Stagnant Wages
Inflation has remained modest, but wages have remained stagnant during Obama’s presidency. As of the release of March figures on April 16, the Consumer Price Index for all urban consumers had risen 9.6 percent since Obama first took office.
Wages, however, have not quite kept up with the rise in the price of consumer goods. The BLS reported that “real” average weekly earnings for rank-and-file workers, as measured by the monthly national payroll survey, had actually declined 0.2 percent over Obama’s time in office.
Stock Market
Stock prices, which plunged during the 2007-2009 recession, have continued to rebound since our last report. As of the market’s close on April 16, the Standard & Poor’s 500-stock index stood 96 percent above where it was when the president first came to office in 2009, and very close to the record high set in October 2007. The Dow Jones Industrial Average had gone up 86 percent. Both the Dow and the S&P 500 have set record highs in recent days.
The NASDAQ Composite index had more than doubled — closing on April 16 at 127 percent higher than it was when Obama was first inaugurated — but was still short of the record the tech-heavy index set in 2000 before the dot-com bubble burst.
Federal Debt: Nearly Doubled
The federal debt has risen even more since our initial reports. During the four years of Obama’s first term, the debt owed to the public rose 83.5 percent. And it has continued to rise during the first weeks of his second term. As of April 15, it stood 90 percent higher than it did when Obama took office in 2009.
Total federal debt — counting intergovernmental borrowings, such as the Social Security trust funds — rose by nearly 55 percent during the first term, and is now 58 percent higher than it was on Jan. 20, 2009, when Obama was first sworn in.
But at least the red ink is accumulating a bit more slowly. CBO estimates the current fiscal year (which ends Sept. 30) will see a deficit of $845 billion — the first time in five years that the yearly shortfall will be below $1 trillion. That assumes that current law remains in place, including the automatic spending cuts that began to take effect March 1. Or, alternatively, that Congress implements different spending cuts of the same amount.
Federal Spending
For all the talk of spending “cuts,” the fact is that spending by the federal government has continued to rise under Obama. But it has gone up far less rapidly than it did under Bush.
The Office of Management and Budget projects federal spending in the current fiscal year (which ends Sept. 30) to be just under $3.7 trillion — or 4 percent more than it was in 2012.
By our calculations, spending has risen a total of 11.2 percent since Obama first took office — counting $203 billion in new spending added under Obama in fiscal 2009. That’s the most we figure Obama can fairly be credited with adding to the FY2009 spending levels he inherited from Bush after he took office nearly four months into the fiscal year. For details on how we arrived at that figure, see our June 4 “Obama’s Spending” article.
By comparison, federal outlays increased by 33 percent in Bush’s first term (comparing actual spending for fiscal 2005 with that for fiscal 2001, which was the last year for which Bill Clinton set spending levels). And spending rose another 34 percent in Bush’s final term, even after subtracting Obama’s $203 billion from fiscal 2009.
As we pointed out in our June article, one Republican analyst has credited Obama with adding somewhat less spending than we do to Bush’s fiscal 2009 levels. So it could be argued that spending rose a bit more in Bush’s last term, and has risen a bit less since then, than our figures indicate. But even so, federal spending rose at least three times faster under Bush than it has so far under Obama.
Food Stamps
The rise in food-stamp recipients has continued despite the improving economy. What Newt Gingrich claimed — prematurely — during his 2012 presidential campaign has now come true: More persons have been added to the food-stamp rolls under Obama than under any single previous president.
As of January, the most recent month for which the Department of Agriculture has released figures, nearly 47.8 million persons were receiving aid through the Supplemental Nutrition Assistance Program. That’s a rise of nearly 15.8 million under Obama, more than the 14.7 million that were added during Bush’s eight years in office.
The total is now 49 percent higher than when Obama first took office, and 3 percentage points higher than it was when we issued our first “Obama’s Numbers” scorecard last year, based on figures from July.
The average monthly benefit was $274.04 per household as of January, and the program is distributing over $6.3 billion per month in benefits.
Oil Production and Imports
What Obama’s 2008 opponent advocated — “Drill, baby, drill” — has come to pass. Whether that’s because of Obama’s policies or in spite of them is something we won’t attempt to assess here, as it’s a matter of opinion. But the facts are that U.S. oil drilling has increased, production has surged, and imports have dropped dramatically.
Figures from the U.S. Energy Information Administration reveal that the number of oil and gas drilling rigs operating in January was 13.1 percent higher than during the same month four years earlier, when Obama was sworn in.
Meanwhile, U.S. crude oil production was 29.4 percent higher in 2012 than it was in 2008, the year before Obama took office. And the net amount of oil and other petroleum products imported from abroad has fallen by almost exactly one-third — 33.3 percent — between 2008 and 2012.
U.S. dependency on foreign oil peaked at just over 60 percent in 2005 after decades of increase. (See Table 3.3a in the most recent EIA Monthly Energy Review, under “net imports as share of products supplied.”) But in Bush’s last few years that figure began to edge downward, reaching 57 percent in 2008.
The trend has accelerated dramatically since Obama took office, and oil dependency was down to just below 40 percent for all of last year. EIA preliminary figures show the dependency on foreign oil was below 36 percent for the first two months of 2013.
Wind and Solar Power
The amount of electricity generated from wind and solar power has now increased 157 percent since the year before Obama took office, according to the latest figures from the U.S. Energy Information Administration.
Wind and solar still account for only a small fraction of all electricity, but the share has more than doubled. It has grown from 1.4 percent of all electricity in 2008 to 3.6 percent during the 12 months ending in January, the most recent period for which EIA gives figures.
We note here that the trend upward also predates Obama’s tenure. Wind and solar power increased 282 percent during Bush’s last four years in office, for example. But the subsidies provided in Obama’s 2009 stimulus package helped keep the trend going.
Fuel Economy
The president can rightly claim that he has doubled the fuel mileage that government standards will require automakers to achieve by 2025, when the standard for light trucks and cars will reach 54.5 miles per gallon. But what’s been achieved so far in the real world is more modest.
According to the University of Michigan’s Transportation Research Institute, the average EPA city/highway sticker mileage of light duty vehicles sold in March was 24.6 miles per gallon. That’s a record. And it’s 17 percent better than the 21.0 mpg for vehicles sold in January 2009, when Obama first took office.
Gasoline Prices
Gasoline prices — not included in our graphic — have remained volatile, but have yet to equal the record $4.11 national average price for regular that was seen in July 2008.
The price when Obama first took office was an unusually low $1.85 per gallon, held down by the worldwide economic recession he inherited. It later more than doubled to a high of $3.97, in May 2011. Last week it was $3.54, an increase of 92 percent since he first took office, but still well short of the record.
Immigration
Reliable figures on illegal immigration and border enforcement are hard to come by. The U.S. Immigrations and Customs Enforcement agency reports that it deported 409,849 individuals in fiscal 2012, an increase of 11 percent over the total for the same period four years earlier (fiscal 2008, the last full fiscal year completed under Bush). But the reported increases under Obama have been the subject of dispute. The Washington Post reported that the Obama administration inflated the deportation numbers in fiscal 2010. Numbers USA, a group urging stricter controls on immigration, and Republican Rep. Lamar Smith of Texas have accused ICE of continuing to inflate the figures. ICE did not return our phone calls or respond to requests for clarification and for more up-to-date monthly figures.
One figure we deemed solid enough to include in our graphic is the number of border patrol agents, which increased 6.3 percent between fiscal 2009 (for which Bush was mostly responsible) and last fiscal year. In essence, Bush roughly doubled the number of agents, and Obama has maintained and even slightly increased that high level, at least until the recent automatic budget cuts, which may cause some agents to be furloughed.
Drone Strikes and Military Fatalities
According to figures we obtained from the Department of Defense, a total of 263 U.S. military personnel died in the Iraq war after 2008. Obama withdrew all U.S. forces from that country in December 2011.
Meanwhile, he increased the number of troops in Afghanistan, where 1,564 U.S. military men and women have died since 2008.
And he dramatically increased the use of covert, remote-controlled drones and missiles to attack targets in Pakistan and Yemen. No official figures are available, and for a time the Obama administration would not even publicly admit that such CIA-controlled attacks were taking place.
But an independent estimate by the nonpartisan New America Foundation, based on what it deems to be “credible news reports,” puts the number of attacks at 374 since Obama took office, an increase of 665 percent over the number that took place while Bush was in office. Estimates by the Bureau of Investigative Journalism in Britain, while slightly different, give a similar picture.
Tax Rates
Obama was first elected in 2008 on a promise not to raise taxes on anyone making less than $250,000 a year in family income. That’s a promise he’s fulfilled with only minor exceptions, such as a 10 percent tax on tanning salons included in the Affordable Care Act. Meanwhile, his 2009 stimulus package delivered temporary tax cuts for most working people, and for all of 2011 and 2012, he secured a 2 percentage point reduction in the Social Security payroll tax.
For his entire first term, the federal income tax cuts signed by Bush in 2001 and 2003 remained in effect, with no increase on anyone. As of 2013, a result of the “fiscal cliff” deal struck with House Republicans at the end of last year, the top income tax rate will go up by 4.6 percentage points, to 39.6 percent — the same top rate that applied during Clinton’s administration.
The new top rate only applies to family income over $450,000, or single income over $400,000. Income under those limits will be taxed at the same rates set by the Bush tax legislation, plus a bit more in many cases.
Persons with more than $250,000 in family income (and singles with over $200,000 income) also face some additional taxes under the Affordable Care Act, including an additional 3.8 percent tax on net “investment income” and a 0.9 percent add-on Medicare tax on payroll income exceeding $200,000. Both of those new taxes took effect Jan. 1.
We’ll file our next quarterly update on statistics reflecting the Obama presidency in early June.
— by Brooks Jackson
Sources
U.S. Bureau of Labor Statistics. “Employment, Hours, and Earnings from the Current Employment Statistics survey.” Accessed 15 Apr 2013.
National Bureau of Economic Research. “US Business Cycle Expansions and Contractions.” Accessed 15 Apr 2013.
U.S. Bureau of Labor Statistics. “BLS National Establishment Survey Estimates Revised to Incorporate March 2012 Benchmarks.” Accessed 15 Apr 2013.
U.S. Bureau of Labor Statistics. “Labor Force Statistics from the Current Population Survey.” Unemployment Rate. Accessed 15 Apr 2013.
Congressional Budget Office. “Testimony on the Budget and Economic Outlook: Fiscal Years 2013 to 2023.” 26 Feb 2013.
U.S. Bureau of Labor Statistics. “Inflation & Prices.” Accessed 15 Apr 2013.
U.S. Bureau of Labor Statistics. “Pay & Benefits.” Accessed 15 Apr 2013.
Google Finance. “S&P 500.” Historical prices. Accessed 16 Apr 2013.
Google Finance. “Dow Jones Industrial Average.” Historical prices. Accessed 16 Apr 2013.
Farrell, Maureen. “Dow and S&P 500 close at new record highs.” CNN Money. 10 Apr 2013.
Google Finance. “NASDAQ Composite.” Historical prices. Accessed 16 Apr 2013.
Witkowski, Wallace. “New Nasdaq record? Don’t hold your breath.” Wall Street Journal MarketWatch. 5 Mar 2013.
U.S. Treasury, Treasurydirect.gov. “The Debt to the Penny and Who Holds It.” Accessed 15 Apr 2013.
Office of Management and Budget. “Table 1.1 — Summary of Receipts, Outlays, and Surpluses or Deficits.” Accessed 15 Apr 2013.
Jackson, Brooks. “Obama’s Spending, ‘Inferno’ or Not?” FactCheck.org. 4 Jun 2012.
Jackson, Brooks. “Newt’s Faulty Food Stamp Claim.” FactCheck.org. 5 Feb 2012.
U.S. Department of Agriculture. “Monthly Data — National Level: FY 2011 through January 2013.” As of 5 Apr 2013, accessed 15 Apr 2013.
U.S. Energy Information Administration. “U.S. Crude Oil and Natural Gas Rotary Rigs in Operation.” Accessed 15 Apr 2013.
U.S. Energy Information Administration. “U.S. Crude Oil Production.” Accessed 15 Apr 2013.
U.S. Energy Information Administration. “Table 3.3a. Monthly Energy Review.” Mar 2013.
U.S. Energy Information Administration. “Table 1.1.A. Net Generation by Other Renewables: Total (All Sectors), 2002-January 2013.” 22 Mar 2013.
Press release. “President Obama Announces Historic 54.5 mpg Fuel Efficiency Standard/Consumers will save $1.7 trillion at the pump, $8K per vehicle by 2025.” U.S. Environmental Protection Agency. 29 Jul 2011.
University of Michigan Transportation Research Institute. “Average sales-weighted fuel-economy rating (window sticker) of purchased new vehicles for October 2007 through March 2013.” 3 Apr 2013.
U.S. Energy Information Administration. “Weekly U.S. Regular All Formulations Retail Gasoline Prices (Dollars per Gallon).” Accessed 15 Apr 2013.
U.S. Immigration and Customs Enforcement. “Removal Statistics.” Accessed 15 Apr 2013.
U.S. Immigration and Customs Enforcement. “ICE Total Removals Through August 25th, 2012.” Accessed 15 Apr 2013.
Becker, Andrew. “Unusual methods helped ICE break deportation record, e-mails and interviews show.” Washington Post. 6 Dec 2010.
Press release. “How the Obama Administration Inflates Deportation Statistics.” Numbers USA. 12 Feb 2013.
Press release. “Smith: Administration Cooks the Books to Achieve Deportation Numbers.” Office of Rep. Lamar Smith. 24 Aug 2012.
U.S. Border Control. “Border Patrol Agent Staffing By Fiscal Year.” Accessed 15 Apr 2013.
Katz, Eric. “Furlough Reprieve at Customs and Border Protection?” Government Executive. 29 Mar 2013.
Sink, Justin. “Gibbs: I was ordered not to acknowledge drone program existed.” The Hill. 25 Feb 2013.
New America Foundation. “The Year of the Drone: An Analysis of U.S. Drone Strikes in Pakistan, 2004-2013.” Accessed 15 Apr 2013.
New America Foundation. “The Year of the Drone: Methodology.” Accessed 15 Apr 2013.
Kim, Erin. “Obamacare’s ‘tanning tax’ is here to stay.” CNN Money. 28 Jun 2012.
Smith, Matt. “Obama signs bill warding off fiscal cliff.” CNN. 3 Jan 2013.
Tax Foundation. “Federal Individual Income Tax Rates History.” Accessed 15 Apr 2013.
U.S. Internal Revenue Service. “Net Investment Income Tax FAQs.” Accessed 15 Apr 2013.
U.S. Internal Revenue Service. “Questions and Answers for the Additional Medicare Tax.” Accessed 15 Apr 2013.