Summary
In our latest quarterly review of key statistical measures of Barack Obama’s presidency so far, we find:
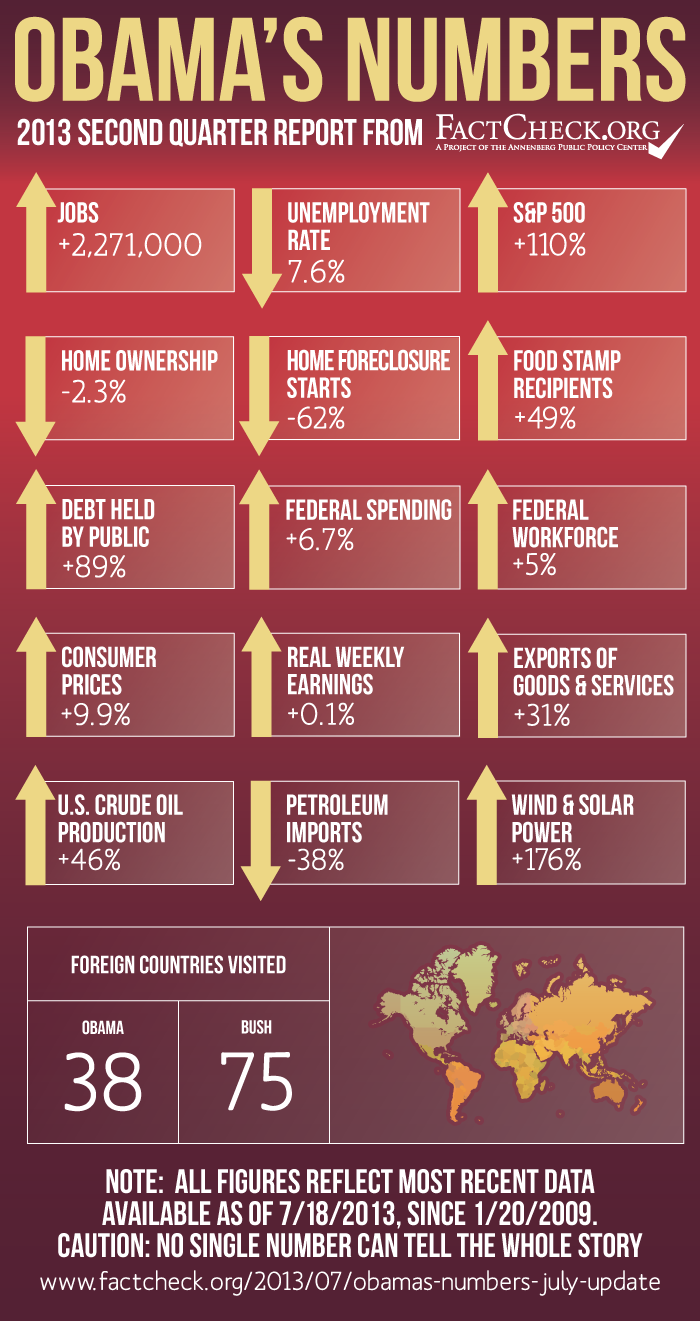
- The economy has now added twice as many jobs since Obama took office than it did in his predecessor’s entire eight years in office.
- Stockholders have grown wealthier; the S&P 500 has gained 110 percent.
- But fewer Americans own their own homes. The rate of home ownership has dropped by 2.3 percentage points.
- However, fewer homeowners are now being forced out by foreclosures. Lenders initiated fewer foreclosure proceedings in June than at any time in the past seven-and-a-half years.
- Consumer prices have risen a modest 9.9 percent since Obama first took office, but wages have barely kept pace. Real weekly earnings rose just 0.1 percent.
- The federal debt declined a bit recently due to the tax-season surge in payments to the Treasury. But the debt is still up nearly 90 percent, and on a path to double.
- While states and cities laid off millions of their workers to make ends meet, the Obama administration continued to hire. The federal workforce is nearly 5 percent larger now, and has grown faster than the U.S. population.
- Obama has now traveled to 38 countries, visiting some more than once. Bush visited 75.
- The president is far short of meeting his goal of doubling U.S. exports. They have risen 31 percent since he took office, and only 2 percent in the most recent 12 months.
- Domestic oil production continues to soar, up 46 percent. Oil imports have plunged by 38 percent. But the U.S. still depends on foreign sources for more than a third of what it consumes.
- Wind and solar power have increased 176 percent. But those sources still make up just 3.8 percent of U.S. electric generation. Coal still accounts for the biggest share: nearly 39 percent.
This is another in our series of regular quarterly updates of key statistical indicators of the Obama presidency. It follows our “Obama’s Numbers” article in October, a preelection update we posted Nov. 5, and our first quarterly update posted April 16.
The mix of statistics in these reports will vary. Some figures that are issued annually will be updated when we have fresh information. And we select figures that are available monthly or quarterly depending on what we judge to be most topical. Our intent is to provide accurate measures of what’s changed — for better or worse — since Obama first took office in January 2009.
Analysis
Jobs & Unemployment
Steady gains in employment pushed the total number of jobs gained under President Obama to 2,271,000 as of June, the most recent period for which the BLS has reported its seasonally adjusted figures for total nonfarm employment.
That’s a gain of 707,000 jobs in the three months since our last update of “Obama’s numbers,” and it’s more than twice as many jobs than were added during George W. Bush’s entire eight years in office. But the June total is still 2,154,000 jobs short of the peak reached in January 2008. Even if gains continue at their present pace it could be nearly next year before the total returns to that historic peak.
Meanwhile, the unemployment rate for June was 7.6 percent, which is unchanged from our last report, and 0.2 percent lower than it was the month Obama first took office. It is still far higher than the average monthly rate of just over 5.3 percent under George W. Bush, or the average of less than 5.2 percent under Bill Clinton.
Stock Market
U.S. stockholders and pension funds continue to grow wealthier under Obama, at least on paper.
As of July 18, the Standard & Poor’s 500-stock index had more than doubled — gaining 110 percent since Obama first took office in the midst of a market plunge caused by the economic crisis of 2007-2009. (It was up 96 percent as of our last report.)
Other market indicators show similar gains. The Dow Jones Industrial Average has gained 88 percent since the level of Jan. 19, 2009 — the last trading day before Obama’s first inauguration. During the same period, the NASDAQ Composite index has gained 151 percent.
Both the DJIA and the S&P have been regularly setting records lately. And the NASDAQ has recently seen its highest levels in 13 years.
Home Ownership
At the same time, fewer Americans own their own homes. The Census Bureau reports that the rate of home ownership was 65.2 percent in the first three months of this year, after accounting for normal seasonal variation. That’s down 2.3 percentage points from the fourth quarter of 2008.
The downward trend started long before Obama took office, however. The seasonally adjusted home ownership rate reached its peak of 69.4 percent in the April-June quarter of 2004, toward the end of George W. Bush’s first term.
Home Foreclosures
On the other hand, fewer Americans are being forced out of their homes. Lenders initiated fewer home foreclosures in June than at any time since before the housing crisis began. According to a July 11 midyear report from RealtyTrac, a real-estate data firm, U.S. foreclosure starts in June were down to the lowest monthly level since December 2005 — a seven-and-a-half-year low.
 The housing crisis began long before Obama took office, and new foreclosure actions reached a peak in April 2009, three months after he took office. But they’ve been headed mostly down ever since. Detailed monthly figures supplied to us by RealtyTrac show that new foreclosure starts in June were 62 percent below where they were when Obama was first sworn in.
Food Stamps
Despite the improving economy, the number of people receiving food stamps continues at near-record levels. The number declined just a bit this year after hitting a peak of nearly 47.8 million in December 2012. But even with the slight decline, the number of people in what is now known as the Supplemental Nutrition Assistance Program was 47,548,694 in April, the most recent month for which the Department of Agriculture has published figures. That’s an increase of nearly 49 percent since Obama first took office — the same as we reported three months ago.
As we’ve noted previously, the increase is due in part to the economic downturn that began in late 2007. But the 15.6 million people who have been added under Obama now exceed the 14.7 million who were added under Bush. And the total has remained historically high even as the economy has improved, and as the unemployment rate has declined substantially. As of April, just over 15 percent of the entire U.S. population was on food stamps — more than one in every seven.
Federal Debt
The federal debt isn’t rising as fast as it was at our last report. In fact, it declined a bit as people and corporations settled their 2012 income tax bills in April, producing a seasonal surge in revenue. As of July 16, the amount the Treasury owed to the public was over $11.9 trillion, an increase of 88.9 percent since the day Obama first became president. That’s down slightly from 90 percent as of our last report.
However, the Obama administration is currently projecting an annual deficit of $759 billion this fiscal year, $750 billion next year and $626 billion the year after. So it’s nearly certain that the debt will more than double during the Obama presidency.
Federal Spending
Latest budget estimates show federal spending for the current fiscal year running 6.7 percent above the levels that Obama inherited when he first took office. That’s a smaller increase than the 11.2 percent rise that we cited in our last update of “Obama’s Numbers.” Since then, the White House Office of Management and Budget has issued its regular “Mid-Session Review” showing lower estimated spending levels for the current fiscal year, which ends Sept. 30.
According to the OMB, the federal government is now on track to spend $3.54 trillion this fiscal year, which is $149 billion less than was estimated in April, when the president issued his annual budget proposals. The lower estimated spending for the current year is due in part to the across-the-board spending cuts (the so-called sequester) that Congress enacted. But $71 billion of the reduction comes from higher-than-expected dividend payments to the Treasury from the Fannie Mae and Freddie Mac mortgage enterprises. (Under government accounting methods, that increased income shows up as a reduction in outlays.)
A technical note: To arrive at our 6.7 percent figure, we used the same assumptions as we did in our previous “Obama’s Numbers” update. We compare the OMB’s estimated spending for this year with the actual spending for fiscal year 2009, minus $203 billion in new spending that Obama added to fiscal 2009 spending after taking office. That’s the most we judge Obama can fairly be credited with adding to the fiscal 2009 spending levels he inherited from Bush. For details on how we arrived at that figure, see our June 4, 2012 “Obama’s Spending” article.
Obama’s spending increases have been far more modest than his predecessor’s. Federal outlays increased by 33 percent in Bush’s first term (comparing actual spending for fiscal 2005 with that for fiscal 2001, which was the last year for which Bill Clinton set spending levels). And spending rose another 34 percent in Bush’s final term, even after subtracting Obama’s $203 billion from fiscal 2009.
As we pointed out in our June article, one Republican analyst has credited Obama with adding somewhat less spending than we do to Bush’s fiscal 2009 levels. So it could be argued that spending rose a bit more in Bush’s last term, and has risen a bit less since then, than our figures indicate. But even so, federal spending rose at least three times faster under Bush than it has so far under Obama.
For the record, Obama’s budget team estimates spending will rise by 6.7 percent in fiscal 2014 and an additional 3.7 percent the following year. Whether Congress will go along with those spending levels remains to be seen.
Federal Workforce
The size of the federal workforce has grown somewhat faster than the U.S. population as a whole under Obama, even as state and local governments have laid off hundreds of thousands of workers.
The Bureau of Labor Statistics reports that as of June, the federal government employed 2,160,700 civilians, not counting the independent U.S. Postal Service. That’s 100,700 more than were employed when Obama took office in January 2009 — an increase of just under 5 percent. (The BLS figures are adjusted to take into account normal seasonal variations.)
Meanwhile the U.S. population has increased about 3.4 percent, according to figures from the U.S. Census. The bureau estimated U.S. population at 315,957,951 as of June 1, up from the 305,714,782 estimate for Feb. 1, 2009, just after Obama took office.
During the same period, the financially beleaguered U.S. Postal Service has shrunk its workforce by 136,300, or nearly 19 percent. And to balance their budgets, hard-pressed state governments have shed a collective total of 190,000 workers, a cut of 3.6 percent, and local governments have cut 506,000 teachers, firefighters, police and other municipal workers, a reduction of 3.5 percent.
Overseas Travel
Obama’s recent trip to three countries in Africa brought the list of countries he’s visited as president (several of them more than once) to 38, based on a list provided by the State Department’s historian. The cost of such travel is enormous. Although the total cost of all Obama’s travels isn’t made public, the Washington Post estimated the Africa trip could cost the federal government $60 million to $100 million based on the costs of similar African trips in recent years.
But Obama’s overseas travels aren’t out of line with those of recent presidents. The State Department lists 75 countries visited by George W. Bush during his eight years in office. Obama has a long way to go — quite literally — to equal Bush’s travels.
Exports
The president also has a long way to go to meet a goal he set in his 2010 State of the Union address, when he promised to double the export of U.S. goods and services. So far, exports have increased only 31 percent since Obama took office, according to data from the U.S. Commerce Department. (We compared seasonally adjusted figures for the fourth quarter of 2008 with those for the first three months of this year, the most recent figures available.)
The president’s efforts to boost exports have run into strong economic headwinds. Europe has been mired in a seemingly endless economic recession, and growth has slowed markedly in China as well. With overseas customers struggling, U.S. exports grew only 2 percent in the most recent 12 months on record.
Prices
Inflation has been quite moderate by historical standards during the Obama presidency. The Consumer Price Index for June stood just 9.9 percent higher than it did when Obama first took office. But fuel prices, which consumers feel every time they pump gasoline, have taken a wild ride.
The national average price of regular gasoline ticked up to $3.64 in the week ended July 15, according to the U.S. Energy Information Administration. That was nearly double the price of $1.85 for the week ending Jan. 19, 2009, when a worldwide recession was pushing down demand. It’s also 10 percent higher than it was when Obama began his second term in January.
But the price under Obama hasn’t yet reached the record $4.11 set in July 2008, under Bush. The highest price posted under Obama was $3.97 in the week ended May 9, 2011.
Wages
Meanwhile, wages have remained stagnant, barely keeping pace with rising prices. The most recent BLS figures for real (inflation-adjusted) weekly earnings stood just 0.1 percent higher in June than when Obama first took office. That’s a wee bit better than the change as of our last report three months ago, when real earnings had declined 0.2 percent.
Oil Production
New drilling methods have contributed to a remarkable boom in U.S. oil production that continues apace under Obama. In the April-June quarter of 2013, domestic oil production was running 46 percent higher than in the last quarter of 2008, according to the EIA. At the same time, U.S. oil imports were down by 38 percent. (Both these figures are significantly higher than we reported in April, using annual data rather than quarterly data. We think the quarterly figures give a more up-to-date picture of how these rapidly developing trends are progressing.)
After decades of unproductive talk about reducing U.S. dependency on foreign oil, the nation started reducing that dependency after 2005, and the trend has accelerated under Obama. In the first five months of 2013, the EIA says the U.S. imported just 36.3 percent of the oil it consumed, down from 57 percent for all of 2008, and from the peak of 60.3 percent in 2005.
EIA Administrator Adam Sieminski testified at a July 16 congressional hearing that domestic oil production is now at the highest level since October 1992. The rate of increase “continues to surpass even the most optimistic forecasts of recent years,” he said. Since February 2010, he said, “Texas more than doubled its production and North Dakota’s output nearly tripled.”
Wind & Solar
The amount of electricity generated from wind and solar sources has nearly tripled under Obama. During the most recent 12 months on record (ending in April), the combined total of wind- and solar-generated power was 176 percent higher than it was during 2008. (For the record, the amount increased even more during Bush’s last term — rising by 282 percent, though from a smaller base.)
Wind and solar still supply only a small portion of all U.S. electricity generation, but the share is up to 3.8 percent in the most recent 12 months, compared with 1.4 percent in the year before Obama took office. Coal-fired plants still supply the largest portion — nearly 39 percent. But that’s down from 48 percent in 2008. Natural-gas supplies 29 percent, up from 21 percent in 2008. Nuclear plants supply 19 percent, down a fraction of a percentage point since 2008.
— by Brooks Jackson
Sources
Jackson, Brooks. “Obama’s Numbers.” Factcheck.org. 8 Oct 2012.
Jackson, Brooks. “Obama’s Numbers, Updated.” Factcheck.org. 5 Nov 2012.
Jackson, Brooks. “Obama’s Numbers (Quarterly Update).” Factcheck.org. 16 Apr 2013.
Bureau of Labor Statistics. “Employment, Hours, and Earnings from the Current Employment Statistics survey (National).” Jun 2013.
Bureau of Labor Statistics. “Labor Force Statistics from the Current Population Survey.” Jun 2013.
Google Finance. “S&P 500.” Historical prices. Accessed 18 Jul 2013.
Google Finance. “Dow Jones Industrial Average.” Historical prices. Accessed 18 Jul 2013.
Google Finance. “NASDAQ Composite.” Historical prices. Accessed 18 Jul 2013.
“Dow and S&P Close at Record Highs Today; Nasdaq Closes at Highest Level in 13 Years.” Nasdaq.com. 11 Jul 2013.
“Current Population Survey/Housing Vacancy Survey, Series H-111.” U.S. Census Bureau. Accessed 18 Jul 2013.
Press release. “U.S. Foreclosure Activity Decreases 14 Percent in June to Lowest Level Since December 2006 Despite 34 Percent Jump in Judicial Scheduled Foreclosure Auctions.” RealtyTrac. 9 Jul 2013.
Jackson, Brooks. “Newt’s Faulty Food-Stamp Claim.” FactCheck.org. 18 Jan 2012.
U.S. Census Bureau. “U.S. and World Population Clock.” Accessed, 18 Jul 2013.
U.S. Treasury, Treasurydirect.gov. “The Debt to the Penny and Who Holds It.” Accessed 18 Jul 2013.
Office of Management and Budget. “Mid-Session Review.” 8 Jul 2013.
Jackson, Brooks. “Obama’s Spending, ‘Inferno’ or Not?” FactCheck.org. 4 Jun 2012.
U.S. Census Bureau. “U.S. Population, April 2000-July 2010.” Accessed 18 Jul 2013.
White House. “President Obama’s 2013 Africa Trip.” Accessed 18 Jul 2013.
U.S. Department of State. “Travels of the President.” Accessed 18 Jul 2013.
Leonning, Carol and David Nakamura. “Document: Major resources needed for Obama Africa trip.” Washington Post. 13 Jun 2013.
White House. “Remarks by the President in the State of the Union.” 27 Jan 2010.
Plummer, Brad. “Europe’s endless recession, in one chart.” Washington Post. 15 May 2012.
Stone, Mark. “China Growth Slows In The Second Quarter.” Sky News. 15 Jul 2013.
U.S. Energy Information Administration. “Weekly U.S. Regular All Formulations Retail Gasoline Prices (Dollars per Gallon).” Accessed 18 Jul 2013.
U.S. Energy Information Administration. “U.S. Crude Oil Production.” Accessed 18 Jul 2013.
U.S. Energy Information Administration. “Table 3.3a. Monthly Energy Review.” Jun 2013.
U.S. Senate Committee on Energy and Natural Resources. “Statement of Adam Sieminski, Administrator, Energy Information Administration.” 16 Jul 2013.
U.S. Energy Information Administration. “Table 1.1.A. Net Generation by Other Renewables: Total (All Sectors), 2003-April 2013.” 21 Jun 2013.