Summary
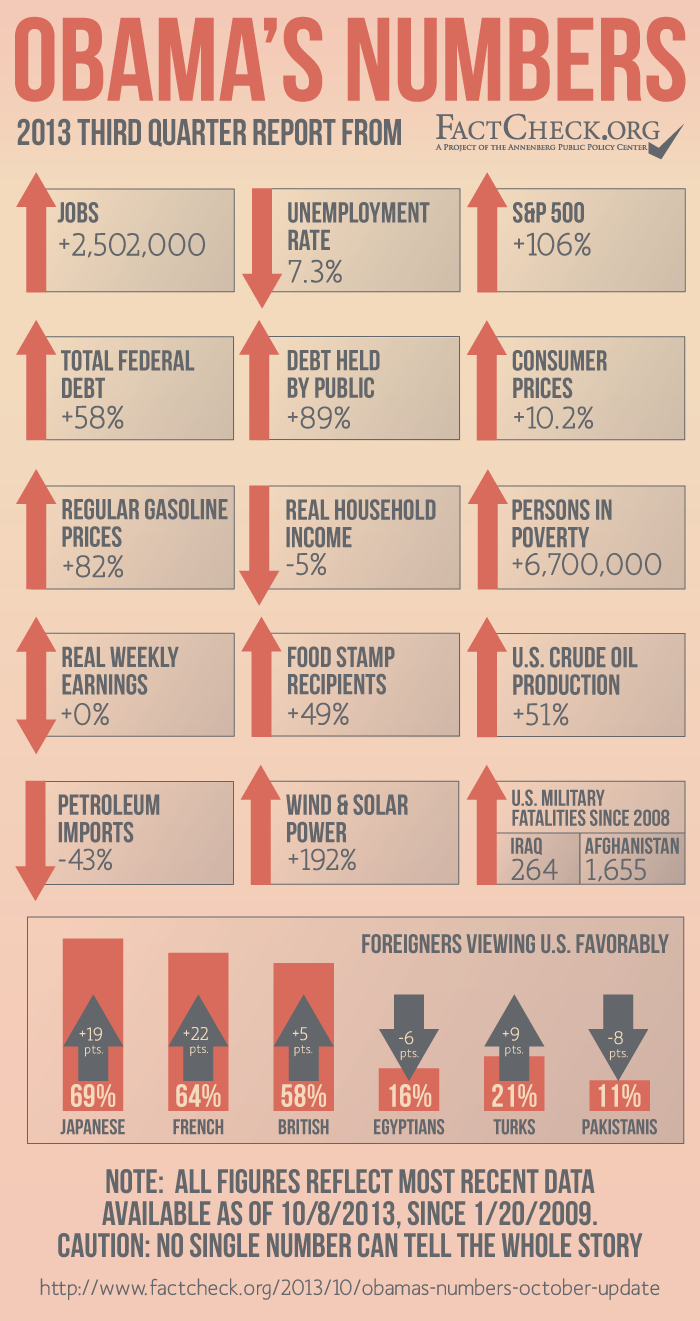
America is still gaining jobs under President Obama, but millions more live in poverty, typical household incomes have not kept pace with inflation, and the federal debt is up nearly 90 percent and on pace to double before he leaves office. Stockholders, meanwhile, are far wealthier than they were the day he was sworn in.
U.S. oil production continues to boom, as do wind and solar power, while dependence on foreign oil keeps dropping. International opinion of the United States has slipped a bit, but generally remains far higher than before he took office, except in the Muslim world, where it has gotten even worse.
These are among the findings in our latest update of “Obama’s Numbers.”
Analysis
This is another in our series of regular quarterly updates of key statistical indicators of the Obama presidency. It follows our “Obama’s Numbers” article in October, a pre-election update we posted Nov. 5, and quarterly updates posted April 16 and July 19.
The mix of statistics in these reports will vary. This update includes income and poverty figures that are issued annually, for example. We select other figures that are available monthly or quarterly depending on what we judge to be most topical. Our intent is to provide accurate measures of what’s changed — for better or worse — since Obama first took office in January 2009.
Jobs and Unemployment
The number of jobs gained since President Obama first took office has now climbed to just over 2.5 million as of August, which is the most recent period for which the Bureau of Labor Statistics has reported its seasonally adjusted figures for total nonfarm employment.
Any additional gains during September have yet to be reported, because BLS was forced to postpone the report it had scheduled for Oct. 4 due to the partial shutdown of the federal government that began Oct. 1. A private report issued by the ADP Research Institute estimated that an additional 166,000 jobs were added during September in the private sector. But we’ll have to wait until after the shutdown is over to see what the BLS reports for total employment, which often differs slightly from the ADP’s estimate of private employment, and which also includes gains and losses in government jobs.
The official BLS estimate for August is still 1,923,000 jobs short of the peak reached in January 2008. Even so, the number of jobs added under Obama is nearly two-and-a-half times the number added during George W. Bush’s entire eight years in office, which were plagued by two economic recessions.
Meanwhile, the unemployment rate for August was 7.3 percent, which is 0.3 percentage points lower than the rate in our last report, and half a percentage point lower than it was the month Obama first took office. While the rate is improving, it is still far higher than the average monthly rate of just over 5.3 percent under George W. Bush, or the average of less than 5.2 percent under Bill Clinton.
Stock Market
As of the market close on Tuesday, Oct. 8, the Standard & Poor’s 500-stock index was down a few points from where it was as of our last update in July — but still 106 percent higher than when Obama first took office. So U.S. stockholders and pension funds remain far wealthier, at least on paper, than they were when the president entered the White House in the midst of a market plunge caused by the economic crisis of 2007-2009.
Other market indicators show similar gains. The Dow Jones Industrial Average has gained 86 percent since Jan. 20, 2009, the day of Obama’s first inauguration. During the same period, the NASDAQ Composite index has gained 156 percent.
What our next update will show is anyone’s guess. So far markets have mostly shrugged off the economic effects of the week-old shutdown, and the looming financial calamity that many experts predict will result if Congress fails to raise the legal ceiling on federal debt and the federal government reneges on paying what it owes to lenders, contractors or both.
Federal Debt
The federal debt has resumed rising since our last report, when it had ticked down temporarily due to a seasonal surge in revenue as persons and corporations paid their 2012 income taxes. As of Oct. 4, the amount the Treasury owed to the public was just under $11.94 trillion, an increase of 89.3 percent since the day Obama first became president. That’s still slightly below the 90 percent rise we reported in our April report.
However, the Obama administration recently projected an annual deficit of $750 billion in the fiscal year that began Oct. 1, and $626 billion the year after. At that rate, the debt owed to the public will more than double during the Obama presidency.
Critics of federal debt levels often cite another, larger figure for total federal debt, which includes money the federal government owes to itself through such devices as the Social Security and Medicare trust funds. That total debt figure stood at just under $16.75 trillion on Oct. 4. That’s an increase of 57.6 percent since Obama was first sworn in.
Prices
Inflation has remained quite moderate by historical standards. As of August, the most recent figure available, the seasonally adjusted Consumer Price Index stood just 10.2 percent higher than it did when Obama first took office.
Even the highly volatile — and visible — price of gasoline at the pump has moderated recently. The national average price of regular gasoline went down to $3.37 in the week ending Oct. 7. (For some reason, the U.S. Energy Information Administration has continued to post fresh figures while other federal statistical agencies have turned out the lights during the shutdown.) That’s well below the $3.64 average as of our last report three months earlier, and down even more from the $3.80 level it reached a year ago at the time of our first “Obama’s Numbers” report, when Republicans were making the high price of gasoline an election issue.
The average price for gasoline has zoomed up and down several times under Obama, but it never reached the record $4.11 set in July 2008, under Bush. The highest price posted under Obama was $3.97 in the week ending May 9, 2011. The most recent price is, however, still 82 percent higher than the unusually low average of $1.85 for the week just before Obama first took office, when a worldwide recession was pushing down demand. And it’s 2 percent higher than it was when Obama began his second term in January.
Income and Poverty
Income and wages have stagnated under Obama, and poverty has worsened.
As of 2012, according to the most recent figures reported by the Census Bureau, median (midpoint) income for all U.S. households was $51,017, which was 4.9 percent lower (in inflation-adjusted dollars) than it was in 2008, the year before Obama took office. It was also slightly less — $83 to be exact — than the median for the previous year. As of last year, the effects of the economic recovery had simply not boosted the income of most households enough to keep pace with even the modest price inflation being measured during the period.
The same story applies to family income, which includes many families with two earners. (The “household” figure includes single persons living alone, as well as families.) Median family income in 2012 was $62,241, or 5.1 percent below the inflation-adjusted 2008 level.
The number of persons living in poverty also worsened again in 2012, according to the most recent Census figures. As of last year, 46,496,000 persons lived in households with income below the official poverty line, an increase of nearly 6.7 million since 2008 and 249,000 since 2011. The total poverty rate remained unchanged in 2012 at 15 percent of the total U.S. population. So for the second straight year, the poverty rate was 1.8 points higher than it was in 2008.
Census income and poverty figures are reported only once a year, but even the more up-to-date figures on inflation-adjusted wage income reported by the BLS show no improvement. As of August, the figure for real (inflation-adjusted) weekly earnings for all wage and salary workers stood exactly where it did in January 2009, when Obama first took office.
Food Stamps
The number of people receiving food stamps continues at near-record levels. Recipients of what is now known as the Supplemental Nutrition Assistance Program numbered 47,760,285 in June, the most recent figure reported by the U.S. Department of Agriculture before its website went dark due to the partial federal shutdown. That’s an increase of more than 200,000 since our July update, which was based on figures current as of April. (USDA normally posts monthly figures with about a three-month lag.) The highest monthly total recorded to date was 47,792,056 in December 2012.
The latest figures represent an increase of 49.3 percent since Obama first took office — about 3 percentage points higher than our first report a year ago.
As we’ve noted previously, the increase under Obama is due mainly to the economic downturn that began in late 2007, but also partly to Obama’s signing legislation to increase benefit levels and to allow able-bodied single persons to receive food stamps. The nearly 15.8 million people who have been added under Obama now exceed the 14.7 million who were added under Bush. And the total has remained historically high even as the economy has improved, and as the unemployment rate has declined substantially. As of June, just over 15 percent of the entire U.S. population remained on food stamps.
Energy Indicators
The remarkable boom in U.S. oil production has continued apace under Obama.
In the July-September quarter of 2013, domestic oil production was running 51 percent higher than in the last quarter of 2008, according to the EIA. At the same time, U.S. oil imports were down by 43 percent. Both those figures are several percentage points higher than we reported just three months ago, showing how remarkably rapid this energy transformation has become. Another indicator: The Wall Street Journal reported Oct. 2 that the U.S. is about to become the largest producer of oil and gas on the planet, overtaking Russia.
As oil production has gone up and oil imports have declined, U.S. dependency on foreign oil has declined sharply. In the first eight months of 2013, the EIA says the U.S. imported just 35.3 percent of the oil it consumed, down from 57 percent for all of 2008 and from the peak of 60.3 percent in 2005, when the current trend began.
Meanwhile, the trend to producing more electricity from wind and solar sources has also continued under Obama. During the most recent 12 months on record (ending in July) wind- and solar-generated electricity was 192 percent higher than in 2008, according to the EIA. Wind and solar power also increased sharply during Bush’s last term — rising by 282 percent — but from a smaller base.
Viewed another way, wind and solar accounted for 4 percent of all U.S. electricity generation during the most recent 12 months on record, up from 3.8 percent in our last report and nearly triple the 1.4 percent share in the year before Obama took office. Coal-fired plants still supply the largest portion — just over 39 percent. But that’s down from 48 percent in 2008. Natural gas supplied 28 percent and nuclear plants supplied 19 percent in the most recent 12 months.
War and World Opinion
Although Obama pulled U.S. troops out of Iraq at the end of 2011, the war in Afghanistan still grinds on. According to year-by-year compilations by icasualties.org of official casualty figures, the U.S. has suffered 264 military fatalities in Iraq since 2008, and 1,655 in Afghanistan (including 111 so far this year).
Meanwhile, world opinion of the United States has slipped since we last reported on it a year ago, but is still much better than it was before Obama entered office.
The Pew Global Attitudes Project conducts annual polling in many foreign nations, and reports that overall opinion remained generally favorable in 2013. Pew reported most recently that in 28 of 38 nations where it had polled, half or more of those surveyed expressed a favorable opinion of the U.S. in 2013. That’s an about-face from Pew’s results in 2008, when only nine of 23 nations polled reported half or more with a favorable opinion of the U.S.
The gains, and also the recent slippage, can be seen for example in Japan, where 69 percent of those polled in 2013 said they had a favorable opinion of the U.S. That’s down 3 percentage points from 2012, but still 19 points higher than in 2008.
A similar result can be seen in France, where 64 percent reported a favorable opinion in 2013. That’s down 5 percentage points from the previous year, but still 22 points higher than in 2008. And in Britain, 58 percent said they approved of the U.S., down 2 percentage points from the previous year but still 5 points higher than in the last year of the Bush administration.
However, approval of the U.S. in key Muslim nations remains abysmal, despite the president’s early efforts to make a “new beginning” with Muslims around the world. In Pakistan only 11 percent reported a favorable opinion of the U.S., down 1 percentage point from a year earlier and 8 points lower than in 2008. In Egypt, 16 percent said they approved of the U.S., down 3 percentage points from 2012 and 6 points lower than in 2008. And in Turkey — where favorable opinion of the U.S. improved by 6 percentage points in 2013 and by 9 points since 2008 — it still stood at only 21 percent this year.
— by Brooks Jackson
Sources
Jackson, Brooks. “Obama’s Numbers.” Factcheck.org. 8 Oct 2012.
Jackson, Brooks. “Obama’s Numbers, Updated.” Factcheck.org. 5 Nov 2012.
Jackson, Brooks. “Obama’s Numbers (Quarterly Update).” Factcheck.org. 16 Apr 2013.
Jackson, Brooks. “Obama’s Numbers: July Update.” Factcheck.org. 19 July 2013.
Bureau of Labor Statistics. “Employment, Hours, and Earnings from the Current Employment Statistics survey (National).” Aug 2013.
ADP Research Institute. “ADP National Employment Report.” Sep 2013.
Bureau of Labor Statistics. “Labor Force Statistics from the Current Population Survey.” Aug 2013.
Google Finance. “S&P 500.” Historical prices. Accessed 8 Oct 2013.
Google Finance. “Dow Jones Industrial Average.” Historical prices. Accessed 8 Oct 2013.
Google Finance. “NASDAQ Composite.” Historical prices. Accessed 8 Oct 2013.
Onaran, Yalman. “A U.S. Default Seen as Catastrophe Dwarfing Lehman’s Fall.” Bloomberg News. 7 Oct 2013.
Solomon, Deborah and Dan Strumpf. “Top Bankers Warn on U.S. Debt Proposal.” Wall Street Journal. 7 Oct 2013.
U.S. Treasury, Treasurydirect.gov. “The Debt to the Penny and Who Holds It.” Accessed 8 Oct 2013.
Jackson, Brooks. “Newt’s Faulty Food-Stamp Claim.” FactCheck.org. 18 Jan 2012.
Office of Management and Budget. “Mid-Session Review.” 8 Jul 2013.
Bureau of Labor Statistics. “Consumer Price Index – All Urban Consumers. Seasonally Adjusted” Aug 2013. Data extracted 8 Oct 2013.
U.S. Energy Information Administration. “Weekly U.S. Regular All Formulations Retail Gasoline Prices (Dollars per Gallon).” Accessed 8 Oct 2013.
U.S. Energy Information Administration. “U.S. Crude Oil Production.” Accessed 8 Oct 2013.
U.S. Energy Information Administration. “Table 3.3a. Monthly Energy Review.” 25 Sep 2013.
U.S. Energy Information Administration. “Table 1.1.A. Net Generation by Other Renewables: Total (All Sectors), 2003-April 2013.” 20 Sep 2013.
icasualties.org. “Iraq Coalition Military Fatalities By Year.” Accessed 8 Oct 2013.
icasualties.org. “Afghanistan Coalition Military Fatalities By Year.” Accessed 8 Oct 2013.
Pew Global Attitudes Project. “America’s Global Image Remains More Positive than China’s; Chapter 1. Attitudes toward the United States.” 18 Jul 2013.
Pew Global Attitudes Project. “Global Public Opinion in the Bush Years (2001-2008).” 18 Dec 2008.