Summary
Since President Barack Obama first took office:
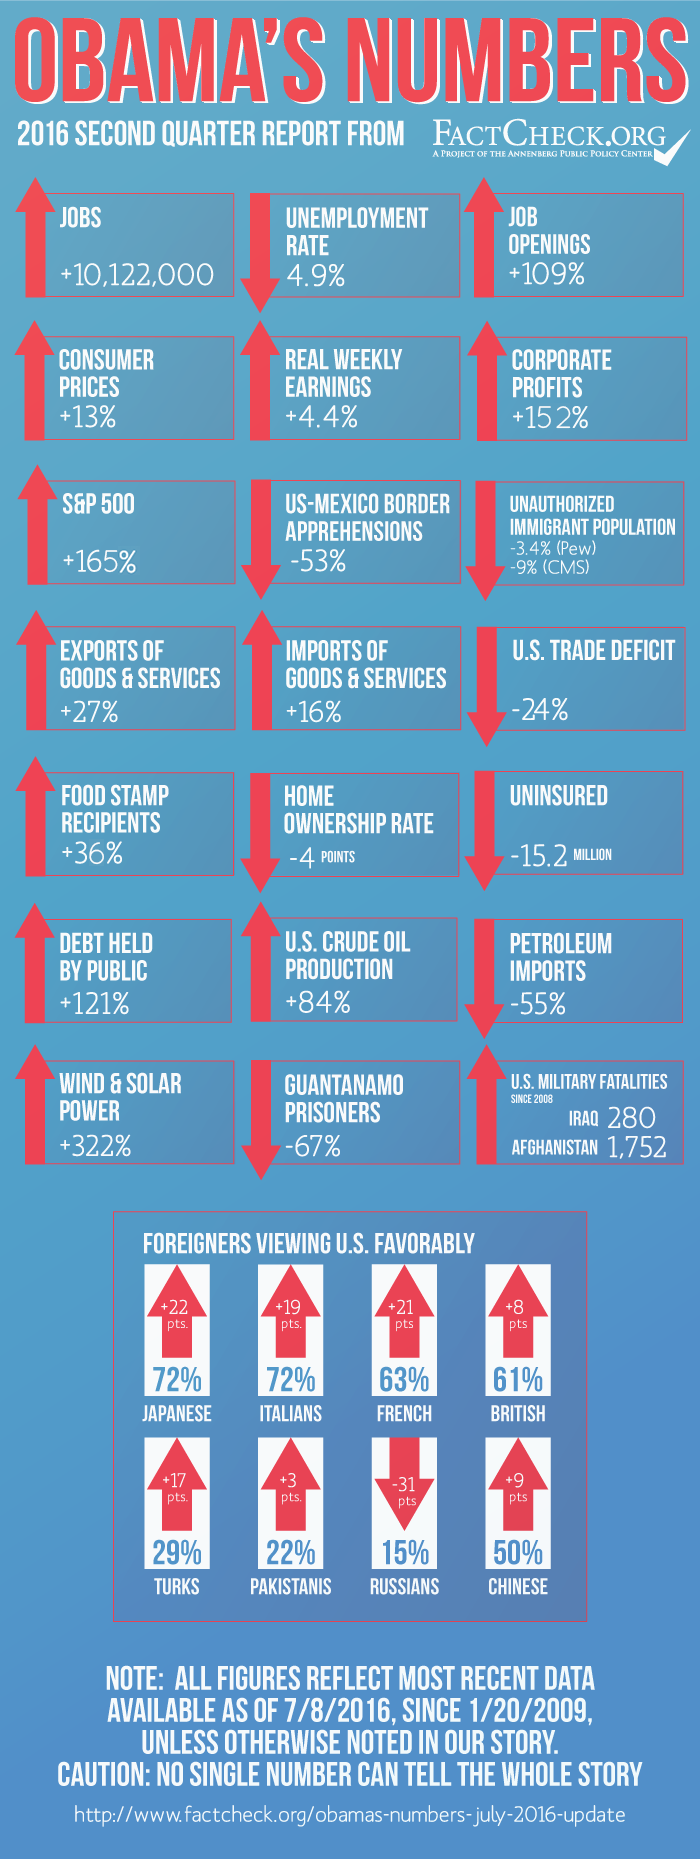
- The economy has added more than 10 million jobs, and job openings are at a 15-year high.
- The unemployment rate has dropped well below the historical norm, but long-term unemployment remains higher than at the start of the Great Recession.
- The buying power of the average worker’s weekly paycheck is up 4.4 percent.
- Corporate profits are running 152 percent higher, and stock prices have soared.
- The number of immigrants caught trying to enter the U.S. illegally has dropped 53 percent.
- Federal debt has more than doubled, and annual deficits, after shrinking, are again on the rise.
- The home ownership rate has dropped by 4 percentage points.
- The number of Americans on food stamps is up 36 percent.
- Oil imports are down 53 percent, and wind and solar power have quadrupled.
- The number of people lacking health insurance has gone down by 15.2 million.
Those are just some of the findings in our latest installment of Obama’s Numbers.
Analysis
As we do every three months, we offer here a fresh update of selected statistical indicators of what has happened since Barack Obama first took the oath of office in January 2009. We leave it to our readers to judge how much credit or blame the president deserves for what has happened on his watch, and we caution that no single number or collection of numbers can tell the entire story. What we offer here are some key yardsticks from sources we consider solid and reliable.
Jobs & Unemployment
Number of Jobs — The economy has added another 401,000 jobs since we published our last report in April. As of June, total nonfarm employment stood 10,122,000 higher than when Obama first took office.
That 10 million gain is less than half the nearly 23 million jobs gained during the booming years of Bill Clinton’s presidency, but far greater than the 1.3 million added during President George W. Bush’s eight years, which were plagued by two recessions.
Unemployment Rate — Meanwhile the unemployment rate has ticked down since our last report to 4.9 percent in June. It had dropped even lower — to 4.7 percent — in May.
It’s now 2.9 percentage points lower than it was in January 2009, when the president first took office in the midst of the worst economic downturn since the Great Depression. The economic crisis drove the unemployment rate to 10 percent within months of Obama’s first entering office.
The jobless rate is now significantly lower than the historical norm. In all the months between 1948 and the time Obama took office, the median jobless rate was 5.5 percent.
Job Openings — The number of job openings has more than doubled under Obama to the highest number in the more than 15 years the Bureau of Labor Statistics has been tracking it.
In April, the most recent month on record, the number of job openings reached 5,788,000, equaling a record first set in July 2015. That’s 109 percent more than in January 2009. The number of job openings now has exceeded 5 million for 15 consecutive months.
Labor Participation Rate —Despite the plentiful availability of jobs, the labor force participation rate declined in June to 62.7 percent.
That rate, which is the portion of the entire civilian population age 16 and older that is either employed or currently looking for work, is now 3 percentage points lower than when Obama took office. That decline is due mostly to the post-World War II baby boomers reaching retirement age, and other demographic factors.
Long-term Unemployment — One lingering effect of the 2007-2009 recession is the number of long-term unemployed — those who have been looking for work for 27 weeks or longer.
There were still nearly 2 million long-term jobless in June. That’s 720,000 fewer than when the president first took office, but still 655,000 higher than in December 2007, at the start of the Great Recession.
The average length of unemployment also remains far above pre-recession levels.
On average, those who were unemployed in June had been without work for 27.7 weeks. That’s 11.1 weeks longer than at the start of the recession, and 7.9 weeks longer than the month Obama first took office.
Prices & Wages
Consumer Prices – Overall inflation during Obama’s time in office has been less than half the historical average.
The average yearly rise in the Consumer Price Index under Obama has been just 1.7 percent, measured from December to December. That’s well under half the post-World War II average, according to BLS figures. From 1946 to 2008, the average December-to-December rise in the CPI was a bit more than 4 percent.
And inflation has slowed as the economy has warmed up. In the most recent 12 months on record, ending in May, the CPI rose less than 1.1 percent.
For the first seven years and four months of Obama’s time in office, the CPI has gone up by only 13 percent. In the eight years of the Bush administration, the CPI went up 20.7 percent.
Gasoline – The national average price of regular gasoline was up to $2.29 per gallon in the week ending July 4, according to the U.S. Energy Information Administration.
That’s up by nearly 21 cents since our last report, but still only 24 percent above the abnormally low point at which it stood on Inauguration Day 2009, when demand was suppressed by a worldwide recession. And it’s 44 percent lower than the record price of more than $4.11 per gallon reached in July 2008, when George W. Bush was in the White House.
Real Weekly Earnings – The recovering economy, coupled with modest increases in prices, has boosted the buying power of weekly paychecks since Obama took office, especially in the last two years.
The BLS measure of average weekly earnings for all workers, adjusted for inflation and seasonal factors, was 4.4 percent higher in May than it was when Obama first took office.
Most of that gain is recent. Real weekly wages are up 1.1 percent in the most recent 12 months, and 3.4 percent in the most recent 24 months.
Those figures include salaried managers and supervisors. But the gains have been almost as large for rank-and-file workers. The BLS measure of inflation-adjusted average weekly earnings for production and nonsupervisory employees was 4.1 percent higher in May than when Obama first entered the White House.
Profits & Markets
Corporate Profits — While workers’ paychecks have grown modestly, corporate profits have positively soared under Obama.
After-tax profits were running at an annual rate of nearly $1.7 trillion in the first quarter of 2016, the most recent figures available. That’s 152 percent higher than in the recession-wracked quarter just before Obama entered office.
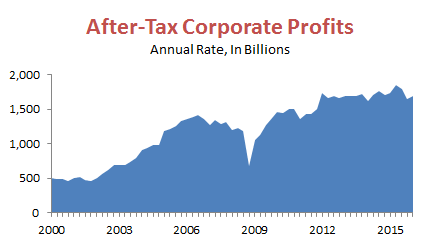
That quarter’s profits were unusually low, ravaged by the worst economic downturn since the Great Depression. But profits bounced back far more quickly than jobs or wages, and have seen an epic run during Obama’s time in office.
After-tax profits have exceeded the best pre-Obama level for the past 20 quarters running. They hit a record rate of more than $1.8 trillion in the second quarter of 2015. The most recent quarterly rate is 20 percent higher than the best quarter prior to Obama’s entering the White House, which was the third quarter of 2006.
Stock Markets – Stockholders continue to do quite well under Obama, despite wild market gyrations in the first quarter of this year and a roller-coaster ride in June following the British vote in favor of leaving the European Union.
After all that, stock prices landed higher than they were as of our last report. The Standard & Poor’s 500-stock index was 165 percent higher at the close on July 8 than it was the day Obama took office.
Other stock indexes show similarly robust gains. The Dow Jones Industrial Average also has more than doubled, rising 128 percent during Obama’s tenure, and the NASDAQ Composite index has more than tripled, rising 244 percent.
Unauthorized Immigrants
Border Crossings — Under Obama, the number of unauthorized immigrants caught trying to cross the U.S.-Mexico border — a key indicator of the flow of illegal immigration — has plunged dramatically. And it has done so while the number of agents stationed at the border has gone up.
Apprehensions at the U.S.-Mexico border fell to 331,333 last fiscal year, a reduction of 53 percent compared with the 705,005 unauthorized immigrants apprehended at the southwest border in the fiscal year that ended Sept. 30, 2008, less than four months before Obama first took office.
The number of agents stationed at the U.S.-Mexico border nearly doubled under President Bush, growing from 9,147 agents at the southwest border in fiscal year 2001 to 17,408 in FY 2009, under funding levels established by Bush.
Under Obama, that number continued to increase, hitting a peak of 18,611 in FY 2013. The number declined to 17,522 in the last fiscal year, about 1 percent above the number Obama inherited.
Unauthorized Immigrant Population — Meanwhile, as we reported in our previous update, the number of people living in the U.S. illegally has declined, according to independent estimates by demographers.
The Pew Research Center estimated the number at 11.7 million in 2008, and most recently at 11.3 million in 2014, a decline of roughly 400,000, or 3.4 percent.
And the Center for Migration Studies estimated that the drop has been even more pronounced, going from 12 million in 2008 to 10.9 million in 2014. That would be a decrease of 1.1 million, or 9 percent. (See Figure 1, page 3.)
Such estimates are inexact; those breaking the law by being here can’t be expected to confess that to Census officials. But demographers have applied consistent methodologies from year to year, and agree that the trend has been downward.
Trade
Exports — As we’ve reported regularly in previous updates, Obama failed spectacularly to deliver on his 2010 promise to “double our exports over the next five years.”
In fact, the most recent quarterly report from the U.S. Bureau of Economic Analysis shows U.S. exports of goods and services have gone up by only 27.2 percent since the quarter before Obama took office.
Lately, exports actually have been shrinking as the economies of China and other U.S. trading partners struggle. First-quarter exports were down 1.8 percent from the previous quarter, and were 5.3 percent below the same period a year earlier.
Imports — Even so, imports have grown even more slowly, and are up only 15.8 percent under Obama.
Lately, both exports and imports have been shrinking — but exports are going down a bit faster. Imports were down 5 percent in the first quarter of 2016, compared with the same period a year earlier. Exports, as mentioned, were down 5.3 percent.
Trade Deficit — As we reported in our previous update, annual figures show the U.S. trade deficit in goods and services shrunk 24 percent between 2008, the year before Obama took office, and 2015, the most recent full year on record.
Now we can also report that the trend is continuing. During the first five months of 2016, the trade deficit has shrunk further, down 3.5 percent compared with the same period in 2015.
Food Stamps
The number of people receiving food stamps has dropped by more than 1.6 million since our last report, another sign of an improving economy.
But as of April, the most recent month on record, nearly 43.6 million Americans were still receiving the food aid, now known as the Supplemental Nutrition Assistance Program.
That’s down by 8.8 percent from the record level set in December 2012, but it is still 36.2 percent higher than it was when Obama took office in 2009.
As we noted when Republicans called Obama the “Food Stamp President,” 14.7 million people were added to the food-stamp rolls during George W. Bush’s time in office. By comparison, the net gain under Obama now stands at under 11.6 million — and the number leaving the food stamp rolls has accelerated lately.
Health Insurance
The number of people lacking health insurance has dropped dramatically under Obama, thanks largely to the Affordable Care Act.
In all of 2015, according to the most recent data from the National Health Interview Survey conducted by the Centers for Disease Control and Prevention, about 28.6 million people of all ages reported being without coverage at the time they were interviewed.
That’s 7.4 million fewer uninsured than in 2014, and 15.2 million fewer than during all of 2008, before Obama took office (see Table 1.1a).
As a percentage of all U.S. residents, the uninsured have dropped to 9.1 percent of the population last year, from 14.7 percent in 2008.
Home Ownership
The home ownership rate slipped back down since our last report, to nearly the lowest point in almost half a century.
In the first quarter of 2016, 63.5 percent of households owned their own home, according to the latest Census Bureau figures.
That’s 0.3 percentage points lower than in the previous quarter, and just 0.1 percentage points above the rate for the second quarter of 2015, which was the lowest since 1967.
The home ownership rate began to slide before Obama took office. It peaked at 69.2 percent in the second quarter of 2004.
But most of the decline since then has occurred under Obama. The most recent rate is 4 percentage points lower than in the quarter just before Obama first entered the White House.
Debt and Deficits
Debt – The federal debt has more than doubled under Obama.
As of July 6, the U.S. government’s debt owed to the public was just shy of $14 trillion, an increase of 121 percent since Obama first took office. That’s practically unchanged since our last report, despite the seasonal influx of tax dollars that pour in around the annual April filing deadline.
The debt also has grown dramatically even when measured as a percentage of the growing economy, from 52 percent of gross domestic product at the end of fiscal year 2009 to a projected 75.4 percent by the end of the current fiscal year, according to the most recent estimate, published March 24, by the nonpartisan Congressional Budget Office.
Deficits – Annual federal deficits hit $1.4 trillion in fiscal year 2009. As we’ve documented elsewhere, Obama inherited most of that deficit and signed spending measures that contributed, at most, $203 billion to FY 2009’s red ink.
Since then, the yearly deficits have declined markedly. In fiscal year 2015, which ended last Sept. 30, the deficit was $438 billion, a drop of 69 percent from FY 2009.
But without further cuts in spending or increases in revenue, Obama will leave his successor with rising debt and deficits.
CBO projects that under current law, annual deficits will rise to $534 billion in the current fiscal year, and will again top $1 trillion in 2022 and beyond. As things stand, federal debt owed to the public will reach nearly 80 percent of GDP in 2022, and nearly 86 percent in 2026, CBO projects.
And even if the GOP-controlled Congress were to accept all of Obama’s current budget proposals — which is not likely — CBO estimates that deficits would shrink for a while, and be smaller (mainly due to proposed tax increases). But they would still rise again soon.
CBO projects that under Obama’s proposed budget, deficits would shrink to $383 billion in fiscal year 2018, and then rise to $972 billion in 2026.
Energy
U.S. Crude Oil Production – Obama has presided over a remarkable boom in U.S. crude oil production, which nearly doubled during his tenure.
In the first quarter of 2016, the U.S. produced 83.7 percent more crude oil than it did in the three months before Obama began his presidency.
To be sure, the boom peaked in April 2015, and production has declined since then. That’s because the price of crude oil plunged from more than $100 a barrel in 2014 to below $30 early this year. That led to a huge drop in drilling. There were only 320 crude oil rigs in operation in May, down from an average of 1,527 during all of 2014, a decline of 79 percent.
And even though the price of crude oil has recovered more recently to around $50, the Energy Information Administration predicted in its June Short-Term Energy Outlook that oil production will continue declining until 2017 before beginning to rise again, assuming that oil prices increase as expected, and that the industry implements productivity improvements.
Oil Imports & Dependency — Under Obama, U.S. reliance on imported oil has been cut by more than half. As of the first quarter of 2016, net imports were down 55 percent.
In 2015, the U.S. imported only 24 percent of the petroleum and refined products that it consumed, which was the lowest annual level of dependency on imports since 1970.
However, with recent declines in U.S. production, dependency on imports has begun creeping upward once again. For the first five months of 2016, imports have accounted for an average of 27 percent of consumption.
The U.S. oil boom is due mainly to advances in drilling technology rather than to any change in government policy. The decline in dependency on imports actually began in 2006, after peaking at 60.3 percent the year before.
Wind & Solar – Wind and solar power has more than quadrupled under Obama. Electricity generated by large-scale wind and solar power in the most recent 12 months on record (ending in April) was 322 percent higher than the total for 2008.
The increase in solar power in particular has been spectacular. The U.S. generated 33 times more electricity from solar power in the most recent 12 months than it did in the year before Obama took office. However, wind and solar still accounted for only 5.9 percent of total large-scale generation in the most recent 12 months (ending in April), up from 1.4 percent in 2008.
These figures are for “utility scale” electricity generation. In 2014, EIA also began tracking small-scale (under 1 megawatt) “distributed” solar voltaic generation, such as the power produced by rooftop systems installed by homeowners. In the most recent 12 months, wind and solar accounted for 6.1 percent of the combined total of utility-scale power and “distributed” solar power.
Car Mileage — The fuel efficiency of new vehicles has not improved since our last report.
The average EPA city/highway sticker mileage of light duty vehicles sold in June was 25.3 miles per gallon, according to the Transportation Research Institute of the University of Michigan. That’s exactly the same as the March figure we cited in our previous update.
These figures leave the president far short of his goal. He boasted in 2013 that “we have doubled the distance our cars will go on a gallon of gas.” What he meant was that the administration was putting in place government requirements that cars and light trucks average 54.5 mpg by model year 2025.
But new-car mileage is now 20 percent higher than when Obama took office, far short of the 100 percent increase he promises.
One reason: Low gasoline prices have prompted consumers to buy more pickup trucks and big sport-utility vehicles, and not so many smaller, thrifty cars. So new-vehicle mileage has actually declined 1.9 percent since peaking in August 2014.
Guantanamo
Since our last report, 10 more prisoners have been released from the military detention camp for suspected terrorists in Guantanamo Bay, Cuba. They include nine prisoners accepted for transfer to Saudi Arabia in April, and a Yemeni prisoner sent to Montenegro on June 22.
But as of July 6, 79 still remained at the facility that Obama ordered to be closed within a year of his first taking office. In the more than seven years since then, the population has been reduced by 67 percent.
More are expected to be released in the closing months of the Obama presidency. The president said in a Dec. 18, 2015, news conference that “we will continue to steadily chip away at the numbers in Guantanamo.” And in February, he gave Congress his plan to transfer the remaining prisoners and finally to close the facility in Cuba.
War Deaths
Since our last report, another U.S. service member has died supporting continuing U.S. operations in Afghanistan. He was a Navy petty officer who died in Djibouti of what the Pentagon described as “a non-combat related injury.”
That death brought the total killed in the Afghan conflict to 1,752 since Obama took office, according to the tally kept by iCasualties.org.
Six more also have died supporting the Iraq conflict, including a Navy SEAL team member killed May 3 in Iraq during what a Pentagon spokesman described as a battle with a large group of Islamic State fighters.
Five others supporting anti-ISIS operations died of non-combat causes: An airman who died April 15 in Southwest Asia as a result of injuries due to a windstorm, a Navy civilian who died April 26 in Bahrain of unspecified non-combat injuries, another Navy civilian who died there April 28, an Army first lieutenant who died at Al Asad Air Base in Iraq, and a Navy sailor who died May 26 while underway with the 5th Fleet in the Red Sea.
Those deaths bring the Iraq total to 280 since Obama became commander in chief.
World Opinion of U.S.
With few exceptions, the U.S. is viewed more favorably overseas now than it was before Obama took office.
According to the most recent polling for the Pew Global Attitudes Project, 72 percent of Japanese said they viewed the U.S. favorably in 2016, up 22 points from 2008.
In Italy, 72 percent said they viewed the U.S. favorably, an increase of 19 percentage points over 2007, the last time Pew polled in Italy prior to Obama’s time in office.
In France, 63 percent viewed the U.S. favorably, up 21 points from 2008. In Britain, it was 61 percent, an increase of 8 points. And in Germany, it was 57 percent, up 26 percentage points from 2008.
The U.S. isn’t viewed so favorably in Turkey, where Pew’s 2015 poll showed a 29 percent favorable rating (Pew hasn’t polled there in 2016). But that was still 17 points higher than in 2008.
Pakistanis also held a dim view of the U.S., giving it only a 22 percent favorable rating in 2015. But even that was 3 points higher than in 2008.
Among the few countries in which the U.S. favorable rating has slipped is Russia, where U.S. favorability plunged to 15 percent in 2015, down 31 percentage points from 2008.
But in China, the most populous nation on earth, 50 percent said this year that they view the U.S. favorably, up 9 points over 2008.
Sources
Bureau of Labor Statistics. “Employment, Hours, and Earnings from the Current Employment Statistics survey (National); Total Nonfarm Employment, Seasonally Adjusted.” Data extracted 8 Jul 2016.
Bureau of Labor Statistics. “Labor Force Statistics from the Current Population Survey; Unemployment Rate, Seasonally Adjusted.” Data extracted 8 Jul 2016.
Bureau of Labor Statistics. “Job Openings and Labor Turnover Survey: Job Openings, Seasonally Adjusted.” Data extracted 8 Jul 2016.
Bureau of Labor Statistics. “Labor Force Statistics from the Current Population Survey; Labor Force Participation Rate.” Data extracted 8 Jul 2016.
Bureau of Labor Statistics. “Labor Force Statistics from the Current Population Survey; Number Unemployed for 27 Weeks & Over, Seasonally Adjusted.” Data extracted 8 Jul 2016.
Bureau of Labor Statistics. “Labor Force Statistics from the Current Population Survey; Average Weeks Unemployed, Seasonally Adjusted.” Data extracted 8 Jul 2016.
Bureau of Labor Statistics. “Consumer Price Index – All Urban Consumers.” Data extracted 8 Jul 2016.
U.S. Energy Information Administration. “Weekly U.S. Regular All Formulations Retail Gasoline Prices (Dollars per Gallon).” Data extracted 5 Apr 2016.
Bureau of Labor Statistics. “Employment, Hours, and Earnings from the Current Employment Statistics survey (National); Average Weekly Earnings of All Employees, 1982-1984 Dollars.” Data extracted 8 Jul 2016.
Bureau of Labor Statistics. “Employment, Hours, and Earnings from the Current Employment Statistics survey (National); Average Weekly Earnings of Production and Non-supervisory Employees, 1982-1984 Dollars.” Data extracted 8 Jul 2016.
Federal Reserve Bank of St Louis. “Corporate Profits After Tax (without IVA and CCAdj) (CP).” Data extracted 8 Jul 2016.
Google Finance. “S&P 500.” Historical prices. Data extracted 8 Jul 2016.
Google Finance. “Dow Jones Industrial Average.” Historical prices. Data extracted 8 Jul 2016.
Google Finance. “NASDAQ Composite.” Historical prices. Data extracted 8 Jul 2016.
United States Border Patrol. “Southwest Border Sectors; Total Illegal Alien Apprehensions By Fiscal Year (Oct. 1st through Sept. 30th).” Undated web page accessed 8 Jul 2016.
United States Border Patrol. “Border Patrol Agent Staffing by Fiscal Year (as of September 19, 2015).” Undated web page accessed 8 Jul 2016.
Passel, Jeffrey et al. “Table A1: Unauthorized Immigrant Population.” Pew Research Center. 3 Sep 2014.
Passel, Jeffrey and D’Vera Cohn. “Unauthorized immigrant population stable for half a decade.” Pew Research Center. 22 Jul 2015.
Warren, Robert. “US Undocumented Population Drops Below 11 Million in 2014, with Continued Declines in the Mexican Undocumented Population.” Journal on Migration and Human Security. Center for Migration Studies. 20 Jan 2016.
U.S. Census Bureau. “U.S. Trade in Goods and Services – Balance of Payments (BOP) Basis.” 4 Mar 2016.
U.S. Department of Commerce, Bureau of Economic Affairs. “Table 1. U.S. International Transactions: Exports of Goods and Services.” 16 Jun 2016.
U.S. Department of Commerce, Bureau of Economic Affairs. “Table 1. U.S. International Transactions: Imports of Goods and Services.” 16 Jun 2016.
U.S. Census Bureau, “U.S. International Trade In Goods And Services, May 2016.” News Release, 6 Jul 2016.
U.S. Department of Agriculture, Food and Nutrition Service. “Supplemental Nutrition Assistance Program (Data as of July 8 2016).” Data extracted 8 Jul 2016.
Centers for Disease Control and Prevention; National Health Interview Survey. “Health Insurance Coverage: Early Release of Estimates From the National Health Interview Survey, 2015.” May 2016.
U.S. Census Bureau. “Time Series: Not Seasonally Adjusted Home Ownership Rate.” Data extracted 8 Jul 2016.
U.S. Treasury. “The Debt to the Penny and Who Holds It.” 6 Jul 2016. Data extracted 8 Jul 2016.
U.S. Treasury. “Final Monthly Treasury Statement of Receipts and Outlays of the United States Government for Fiscal Year 2015.” Oct 2015.
Office of Management and Budget. “Table 1.1—Summary of Receipts, Outlays, and Surpluses or Deficits (-): 1789–2020.” Mar 2015.
Congressional Budget Office. “CBO’s March 2016 Report: Updated Budget Projections: 2016 to 2026.” 24 Mar 2016.
Office of Management and Budget. “Table 1.1—Summary of Receipts, Outlays, and Surpluses or Deficits (-): 1789–2021.” Mar 2016.
U.S. Energy Information Administration. “U.S. Crude Oil Production.” Short Term Energy Outlook. 7 Jun 2016. Data extracted 8 Jul 2016.
U.S. Energy Information Administration. “Table 3.3a. Monthly Energy Review.” 27 Jun 2016.
U.S. Energy Information Administration. Electric Power Monthly, “Table 1.1.A. Net Generation from Renewable Sources: Total (All Sectors), 2006-January 2016.” 24 Jun 2016.
Sivak, Michael and Brandon Schoettle. “Average sales-weighted fuel-economy rating (window sticker) of purchased new vehicles for October 2007 through March 2016.” University of Michigan Transportation Research Institute. 5 Jul 2016.
New York Times. The Guantanamo Docket. “A History of the Detainee Population.” 8 Jul 2016.
iCasualties.org. “Operation Enduring Freedom/Afghanistan; Afghanistan Coalition Military Fatalities by Year.” Data extracted 8 Jul 2016.
iCasualties.org. “Operation Iraqi Freedom; Iraq Coalition Military Fatalities by Year.” Data extracted 8 Jul 2016.
Pew Research Center. “Global Indicators Database; Updated in June with polling data from 2016 spring survey.” Data accessed 8 Jul 2016.