Presidents typically avoid facts and figures when delivering inaugural addresses, serving up a blend of broad platitudes and generalities to lay out a vision. President Donald Trump was no different in that regard.
But in his inaugural address, Trump portrayed the United States as a nation in decline, using rhetoric that did not always match reality:
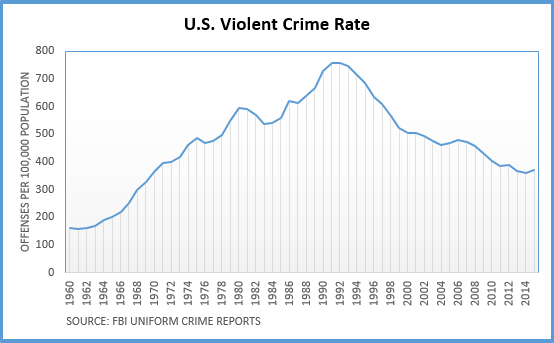
- Trump portrayed the U.S. as crime-ridden and promised to stop the “American carnage.” But the U.S. violent crime rate in 2015 was less than half what it was at its peak in 1991.
- Trump promised to “bring back our jobs.” Manufacturing jobs have been on the decline for decades, but Trump inherits an overall economy that has gained jobs for a record 75 straight months and has an unemployment rate well below the historical norm.
- He said he would “get our people off of welfare and back to work.” But the welfare rolls have declined under President Obama, and they have dropped precipitously since President Clinton signed legislation in 1996 instituting work requirements and time limits.
- Trump promised to “bring back our borders,” blaming past politicians for “refusing to defend our” border. But the U.S. Border Patrol budget has tripled since 2001, and the number of border patrol agents has doubled. Southwest border apprehensions have dropped 75 percent from the peak in fiscal 2000.
Crime ‘Carnage’
As he did so often on the campaign trail, Trump again painted a picture of a crime-ridden nation.
While Americans want “safe neighborhoods for their families,” Trump said, “for too many of our citizens, a different reality exists,” one in which “the crime and the gangs and the drugs … have stolen too many lives and robbed our country of so much unrealized potential.”
“This American carnage stops right here and stops right now,” Trump said.
Although he spoke in general terms this time, Trump has often framed the issue by citing rising violent crime and murder rates — which focuses on a one-year uptick but ignores the long-term trend.
FBI data show the number of overall violent crimes in the U.S. increased by 3.9 percent from 2014 to 2015, and murder and nonnegligent manslaughter went up by 10.8 percent. While authorities are concerned about the one-year violent crime increase, as USA Today reported, the 2015 figure is still lower than in 2011, and 16.5 percent below the level nine years earlier.
As we have noted, the long-term trend nationwide is a decline, not only in murder rates, but for violent crime in general.
As this graph of violent crime rates for the nation shows, the rate has been on a decline since it peaked at 758.2 in 1991. It was less than half that, 372.6 in 2015. (The FBI describes its data as “estimated,” and it comes from the voluntary reports of local law enforcement agencies.)
The murder and nonnegligent manslaughter rate nationwide, at 4.9 in 2015, is less than half the peak of 10.2 in 1980.
On the campaign trail, Trump repeatedly referenced a spike in murders in cities like Chicago. And indeed, several U.S. cities have seen an alarming spike. A New York Times story in May 2016 cited “notable increases in murders in about two dozen cities in the first three months of the year compared to last year and a 9 percent increase nationwide.” Criminology and statistics experts told us they can’t discern a trend from such a small snapshot in time.
An analysis from the Brennan Center for Justice released on Sept. 19, concluded: “Overall crime rates in 2016 are projected to be nearly the same as last year, with crime remaining at an all-time low.” The analysis found that murder increased by 14 percent “with just three cities — Baltimore, Chicago, and Washington, D.C. — responsible for half that increase. All told, 2015’s murder rate was still near historic lows.” The analysis said that “the average person in a large urban area is safer walking on the street today than he or she would have been at almost any time in the past 30 years.”
‘Bring Back Our Jobs’
Trump blamed “other countries” for “destroying our jobs,” and he promised that he would “bring back our jobs.” He did not name the countries or how the jobs were destroyed. But Trump regularly blamed Mexico and China during the campaign, citing the North American Free Trade Agreement and China’s entry into the World Trade Organization. NAFTA took effect Jan. 1, 1994, and China entered the WTO Dec. 11, 2001.
It is true that U.S. manufacturing jobs have declined. The Bureau of Labor Statistics’ website provides data on manufacturing jobs dating to 1939. As of December, there were not quite 12.3 million manufacturing jobs — which is nearly 7.3 million jobs, or about 37 percent, fewer than the peak of more than 19.5 million jobs in June 1979.
However, not all the job losses can be attributed to trade deals, and some of those job losses were offset by job gains elsewhere in the U.S. economy.
For example, a 2015 report from the nonpartisan Congressional Research Service called NAFTA’s impact “relatively modest.” CRS said, “In reality, NAFTA did not cause the huge job losses feared by the critics or the large economic gains predicted by supporters.”
One factor in the job losses is automation, which improved U.S. productivity but reduced jobs. A Jan. 18 CRS report, “U.S. Manufacturing in International Perspective,” noted that “U.S. manufacturers’ large investments in automation … have eliminated many routine assembly jobs; only two in five workers in U.S. manufacturing establishments are now directly engaged in production.”
Overall, Trump inherits a job market that has steadily improved since hitting a post-recession low in 2010. As we wrote in “What President Trump Inherits,” the U.S. economy has gained jobs for 75 straight months (the longest streak on record), and the unemployment rate is 4.7 percent (far below the historical norm since 1948).
There were also more than 5.5 million job openings as of the last business day in November — double the number when Barack Obama took over as president in January 2009. BLS has been keeping track of job openings only since December 2000, but since that time the record high was in April 2016, when job openings topped 5.8 million.
Poverty and Welfare
Trump spoke of “mothers and children trapped in poverty in our inner cities,” and he promised, “We will get our people off of welfare and back to work, rebuilding our country with American hands and American labor.”
On poverty, as we pointed out in “What President Trump Inherits,” there were 43.1 million Americans with incomes below the poverty line in 2015. That’s 3.1 million more living in poverty than in 2008, the year before Obama took office. The 13.5 percent poverty rate, which experienced its biggest one-year drop since 1968 last year, was still three-tenths of a percentage point above where it was in 2008. Poverty figures for 2016 won’t be available until September.
Despite a rise in the number and rate of those living in poverty under Obama, the number on welfare declined, reflecting a long-term trend since then-President Bill Clinton signed welfare overhaul legislation in 1996. That legislation, which created the Temporary Assistance for Needy Families program, or TANF, to replace the Aid to Families With Dependent Children program, imposed time limits for cash assistance and work or work-related requirements for recipients to continue to receive welfare.
The average monthly number of individuals and families on TANF since fiscal year 1997 has declined by 75 percent and 69 percent, respectively. And the AFDC program provided cash assistance to even greater numbers in the years prior. The average monthly number of individuals receiving assistance in fiscal 1970 was 7.9 million. The figure for 2016 was 2.8 million.
Under Obama, the welfare rolls have declined as well. The average monthly number of individuals and families on TANF declined 27 percent and 26 percent, respectively, from fiscal year 2008 to 2016.

The number of people receiving food stamps, the Supplemental Nutrition Assistance Program, has been declining in recent years but is still up overall under Obama’s tenure. As of October 2016, the most recent month on record, 43.2 million people were receiving SNAP benefits.
That’s up 35 percent from January 2009, when Obama was inaugurated, but down 9.6 percent from the record level in December 2012.
‘Bring Back Our Borders’
During the campaign, Trump made immigration a central issue, and it was a topic he returned to in his inaugural address. The newly installed president blamed past politicians for “refusing to defend our” borders, promising to “bring back our borders.”
But the facts tell a different story.
Beginning with President George W. Bush and continuing under President Barack Obama, the U.S. Border Patrol budget went up 218 percent, from nearly $1.2 billion in fiscal year 2001 to $3.6 billion in FY2016.
Under Bush, the total number of Border Patrol agents more than doubled — increasing from 9,821 in fiscal year 2001 (which was the last budget signed by President Clinton) to 20,119 in fiscal year 2009, under funding levels signed by Bush. Under Obama, the number of agents peaked at 21,444, but declined to 19,828 by fiscal 2016. Even so, the number of border patrol agents have doubled since 2001.
While spending has gone up, apprehensions along the U.S.-Mexico border have gone down. In fact, the number of people apprehended while trying to enter the U.S. illegally from Mexico is one-quarter of what it was at its peak over a decade ago.
There were 408,870 apprehensions at the southwest border in fiscal year 2016, which was 75 percent below the peak number of 1,643,679 apprehended in FY2000.