During his confirmation hearing on Jan. 16, Andrew Wheeler, President Donald Trump’s nominee to head the Environmental Protection Agency, repeatedly used a misleading statistic to defend the EPA’s proposed replacement for the Obama administration’s Clean Power Plan.
 In describing the new proposal, known as the Affordable Clean Energy, or ACE, rule, Wheeler said the policy would lead to a 34 percent reduction in CO2 emissions from 2005 levels in 2030. That’s an accurate figure from the EPA, but it lacks context: Almost all of that reduction would happen anyway, not because of the EPA proposal.
ACE, which was announced in late August, targets individual coal-fired power plants and encourages what are called heat rate improvements, or HRIs, which increase efficiency so that more energy is produced from the same amount of coal. This approach to reducing CO2 emissions from power plants differs from the Clean Power Plan, or CPP, which emphasized shifting away from coal as an energy source and would have required states to meet specific emissions reductions using a variety of techniques.
In 2016, the Supreme Court issued a stay preventing the CPP from being implemented after 27 states sued to block the regulations. ACE has not yet been finalized.
‘34 Percent’ Needs More Context
Wheeler, who has been acting EPA administrator since Scott Pruitt’s departure in July, summarized and defended the ACE rule with the 34 percent reduction number no fewer than five times during his confirmation testimony.
After being challenged by Democratic Sen. Jeff Merkley of Oregon, for example, Wheeler said, “My agency experts have told me that we’re going to get a 34 percent reduction in CO2 based on 2005 levels once the ACE regulation is fully implemented.”
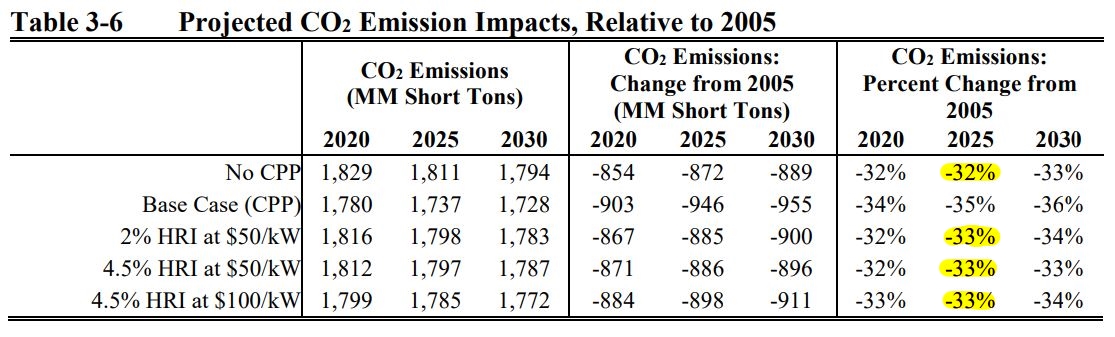
Wheeler’s number is correct — or nearly so. In table 3-6 of the EPA’s Regulatory Impact Analysis, or RIA, for the proposed rule, the agency lists either a 33 percent or 34 percent drop in emissions relative to 2005 in 2030 for the three ACE scenarios. That is close, but not quite correct, due to a labeling error in the table. The data for 2030 are actually in the middle column, meaning the agency’s estimate for all the ACE scenarios is a 33 percent reduction, which also matches the numbers described in the accompanying text.
What Wheeler leaves out, however, is that the vast majority of this percentage is projected to occur without ACE in place. In fact, with no policy at all, the agency estimates a 32 percent drop in emissions relative to 2005 in 2030 (in table 3-6, shown below with highlights).
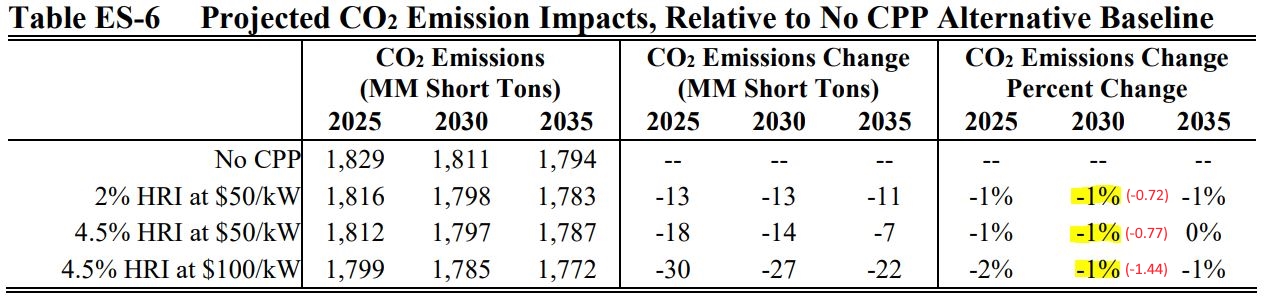
A better measure of how effective ACE would be at reducing CO2 is one that incorporates both pieces of information, and directly compares ACE to a no-policy scenario. Such a number would do away with any comparison to 2005, and cut to the chase: How much lower are emissions expected to be in a given year under the policy? And indeed, the EPA provides those numbers in multiple places in the RIA.
In tables 3-5 and ES-6, for example, the agency lists the percent change in CO2 emissions for the ACE scenarios compared with no policy. Under the three ACE scenarios, CO2 emissions are estimated to be about 1 percent lower in 2030 than what they would be without any policy.
We’ve copied the table below, but also added some of the percentages with less rounding to show more detail.
The roughly 1 percent decline under ACE is the more relevant number for Wheeler to share with senators, not the 34 percent decline from 2005 levels, which should be 33 percent. If sharing the 33 percent, Wheeler should volunteer that 32 of the percentage points are already expected without any policy.
A Changing Baseline
The 33 percent drop under ACE sounds impressive, though, in part because when President Barack Obama first proposed the Clean Power Plan, it was designed to reduce emissions by 32 percent below 2005 levels by 2030.
On the surface, that could make it seem like ACE outperforms the CPP. But the two estimates were made at different times, using different assumptions, and they can’t be compared. We’ll explain later how ACE and the CPP really stack up to one another, but ACE doesn’t lead to a greater reduction in emissions.
One of the biggest things that changed over time was the EPA’s baseline projection for future emissions.
In 2015, when the CPP was developed, the EPA thought emissions would be much higher in 2030. The agency estimated that the policy would reduce CO2 emissions in the electricity sector by 19 percent in 2030, which would be equivalent to 32 percent below 2005 levels. If the U.S. had no policy to reign in carbon emissions from power plants, the agency estimated emissions from the electricity sector would be about 17 percent below 2005 levels in 2030.
By 2018, when the ACE rule was proposed, EPA scientists had revised the expected 2030 emissions downward — so much so, that doing nothing would already meet the once lofty 32 percent below 2005 goal.
This changing baseline explains many of the seemingly contradictory statistics related to the two plans, including why the ACE plan can claim a hefty below-2005 reduction, even though it hardly reduces emissions in 2030.
Why did the baseline change? In short, the U.S. energy sector got cleaner faster than expected as the electricity sector shifted away from coal and more toward natural gas and renewables. Although still a fossil fuel, natural gas usually has a lower carbon footprint than coal.
Many of these changes were precisely the things that the CPP wanted to encourage. As a result, even before ACE was proposed, analysts were downgrading their estimates for how much the CPP would do to reduce CO2 emissions. As the nonpartisan Congressional Research Service explains in a report on the ACE rule, “This reflects the fact that many of the changes EPA expected to result from the CPP (e.g., natural gas and renewables replacing coal-fired units) have already happened as the result of market forces in the electric power sector” (page 25).
This is why there isn’t as big of a difference between CO2 emissions under the CPP and ACE plans as many people might expect. According to the ACE impact analysis, which directly compares both policies, CO2 emissions in 2030 would be about 3 percent to 6 percent higher under ACE than under the CPP (see tables 3-4 and 3-41).
This figure is far lower than has been reported in some major media outlets. Several news organizations, including the New York Times and the Washington Post, have used the CPP’s original estimate of a 19 percent reduction in 2030 and compared it to ACE’s 1 percent reduction. The comparison can give some idea of how ambitious each proposal was, but it doesn’t tell how much each plan is expected to reduce emissions going forward.
We’ve summarized all these wonky figures in the chart below, showing the EPA’s estimates for each metric in 2015 and 2018. Only the numbers from the same year can be directly compared.
EPA-Estimated CO2 Emissions in 2030
| 2015 | 2018 | |||||
| CO2 Emissions (million short tons) | Percent CO2 Emissions Reduction, Relative to No Policy Projection | Percent CO2 Emissions Reduction, Relative to 2005 | CO2 Emissions (million short tons) | Percent CO2 Emissions Reduction, Relative to No Policy Projection | Percent CO2 Emissions Reduction, Relative to 2005 | |
| ACE | NA | NA | NA | 1,785-1,798 | 1% | 33% |
| No policy | 2,227 | 0% | 17% | 1,811 | 0% | 32% |
| CPP | 1,812 | 19% | 32% | 1,695-1,737 | 4-6% | 35-37% |
| Note: This table is adapted from tables 3-5 and 3-6 of the 2015 CPP RIA and tables 3-5, 3-6 and 3-41 of the 2018 ACE RIA. Where percentages differ, we have relied on the listed tons and performed the appropriate calculations. The 2005 emissions figure is 2,683 million short tons. | ||||||
Higher Uncertainty Under ACE
So far, we’ve focused on explaining the EPA’s numbers, but it’s important to mention that there is uncertainty about the agency’s CO2 emissions estimates under the ACE rule.
“While uncertainty is inherent in any projection,” the Congressional Research Service’s report explains, “the emission estimates for the ACE scenarios may contain more uncertainty than the estimates for the CPP.”
Part of this uncertainty stems from the fact that the CPP set concrete, enforceable emissions standards, whereas ACE does not. Under ACE, states would set a standard using an EPA-prepared list of “candidate technologies” for heat rate improvements at coal-fired power plants, including upgrades to steam turbine blades or better computer models that can optimize combustion (CRS report, page 12).
But states would have, in the EPA’s words, “considerable flexibility” in setting these standards, and would be allowed to factor in certain features, such as how much remaining useful life a coal-fired generator has left, the payback period for investments, and space or other physical restraints that might prevent a plant from upgrading, among others (Federal Register, page 44766).
This flexibility makes it difficult to predict what level of heat rate improvements the nation’s fleet of coal-fired power plants might actually achieve, and in turn, what that would do to CO2 emissions. Indeed, the EPA states in its description of the rule in the Federal Register, “Consideration of these factors may result in the application of the standard of performance in a less stringent manner than would otherwise be suggested by strict implementation” of the heat rate improvements.
Another area of uncertainty comes from something called the rebound effect, which is when an efficiency improvement leads to greater use. In the case of a coal-fired power plant, the idea is that while a plant might become cleaner to run, it might then be used more, which could partially or fully offset any emissions reductions.
The EPA says in its proposed rule that the agency’s analysis “indicates that the system-wide emission decreases due to reduced heat rate are likely to be larger than any system-wide increases due to increased operation” (Federal Register, page 44761).
But the CRS report points out that the agency did not factor in any federal initiatives that would extend the life of coal-fired power plants. “Actual emissions under ACE could be higher than estimated emissions,” the report reads, “if the coal-fired power plants that were assumed to retire in EPA’s analysis continue operating beyond planned retirement dates.”
The CRS report also notes that previously, the EPA “raised concerns about the rebound effect—particularly when using an HRI approach in isolation (as is done in the ACE proposal)—and concluded in 2015 that a combined approach using all three building blocks would alleviate such concerns.” In addition to efficiency improvements at coal-fired plants, the CPP contained two other main strategies: shifting from coal to natural gas, and from fossil fuels to renewables.
No one will know, of course, how accurate the EPA’s estimates are for CO2 emissions under ACE until the policy goes into effect and some time passes. Before that happens, though, ACE still needs to be finalized — which an EPA spokesperson told us in an email would happen sometime in 2019, after the agency finishes its review of the 500,000-some comments it received on the proposal. The plan is also expected to face legal challenges.
As for Wheeler, the Senate committee that held his hearing has not yet voted on whether to advance his nomination, although a spokesman for the majority members told us in an email that the vote was scheduled for Feb. 5. Wheeler is expected to be confirmed by the Republican-controlled Senate.
 FactCheck.org Rating: