Summary
In his 2020 address to Congress, President Donald Trump stretched and distorted the facts:
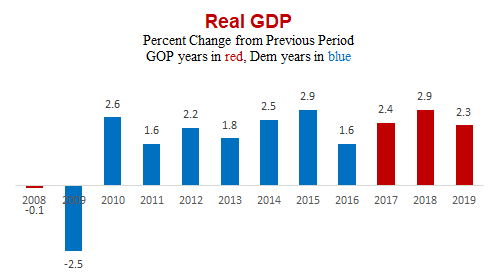
- Trump claimed the economy is “the best it has ever been.” But GDP growth fell to 2.3% last year and economists predict further slowing this year.
- He said he brought about low unemployment by reversing “years of economic decay” and “failed economic policies,” when in fact over 1 million more jobs were added in the 35 months before he took office than in the first 35 months since.
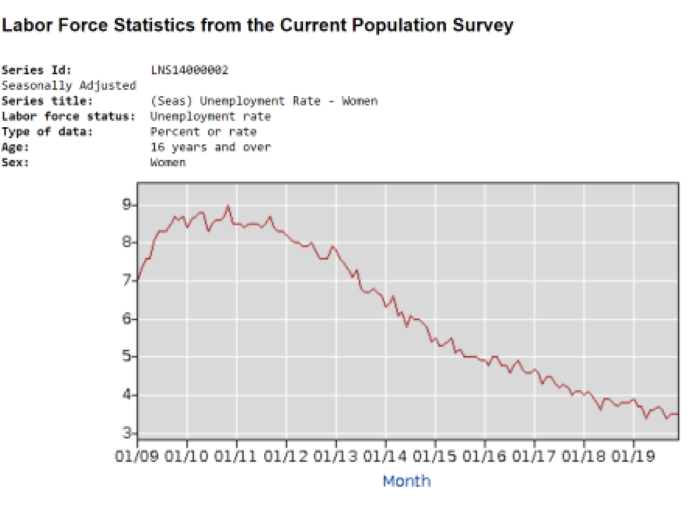
- Trump boasted that the “unemployment rate for women reached the lowest level in almost 70 years.” That’s true, but it had been trending down for several years before he took office.
- The president wrongly said, “After decades of flat and falling incomes, wages are rising fast.” They’ve gone up under Trump, but also have risen under the last several presidents.
- Trump claimed that people’s 401(k)s and pensions have increased “60, 70, 80, 90, and 100% and even more.” Some may have, but that’s far higher than the average.
- He said “real median household income is now at the highest level ever recorded.” However, the Census Bureau noted that was partly due to a change in survey questions in 2014. Based on “adjusted” figures, median household income was slightly higher in 1999 than in 2018.
- Trump claimed the new trade agreement with Canada and Mexico “will create nearly 100,000 … auto jobs.” But an independent federal commission puts the job gains at 28,000 over five years.
- The president boasted that “a long, tall, and very powerful wall is being built” along the southern border, and more than 100 miles have been completed. But only one mile is located where no barriers previously existed.
- Trump said “illegal crossings” at the southwest border “are down 75% since May.” But total apprehensions in 2019 were 81% higher than in 2016, the year before Trump took office.
- He said that “after losing 60,000 factories under the previous two administrations, America has now gained 12,000 new factories under my administration.” He’s referring to what the Bureau of Labor Statistics calls manufacturing “establishments,” and most of the growth under Trump has been in facilities with fewer than five employees.
- Trump compared apples to oranges in claiming a doubling of insurance premiums in five years before he took office and “less expensive” plans under his administration.
- The president said he made an “iron-clad” promise to “always protect patients with preexisting conditions,” but that ignores the fact he has supported Republican health plans that would reduce the current protections under the Affordable Care Act.
- He suggested, misleadingly, that his administration was responsible for the U.S. becoming the world’s top producer of oil and natural gas. But the U.S. has been No. 1 in the world for natural gas for more than a decade, and tops in petroleum since 2013.
- Trump said “300,000 working age people” left the workforce during Obama’s eight years. Actually, the workforce grew by 5.4 million.
We also reviewed the Democratic response and found that Michigan Gov. Gretchen Whitmer got the story on wages wrong, too, when she said they have “stagnated while CEO pay has skyrocketed.” Pay at the top may have grown more rapidly over the long term, but wages overall have gone up.
Analysis
Trump delivered the State of the Union on Feb. 4, a day before the Senate is expected to acquit him in the impeachment trial and nine months before the presidential election.
Trump’s Twisted ‘Comeback’
The president twisted the facts when he said his administration “launched the great American comeback” ending “years of economic decay.” Actually, as we reported three years ago when he took office, the economy was already experiencing steady growth in output, jobs and incomes in the years before he took office.
GDP — Trump boasted that “our economy is the best it has ever been,” which isn’t true.
As of the most recent official estimate the nation’s real (inflation-adjusted) gross domestic product grew 2.3% last year. It grew 2.9% in 2018 and also in 2015, before Trump’s tenure. And it grew 3.8% in 2004 and 3.5% in 2005.
Most economists predict further slowing this year; last month’s Wall Street Journal’s monthly survey of business and university economists produced an average prediction of 1.9% growth for this year, for example.
Jobs — “Since my election, we have created 7 million new jobs,” Trump said (taking credit for thousands of jobs created after the election but while Barack Obama was still president). The most recent figures show that in the 35 months after Trump actually took office, the economy added just under 6.7 million jobs.
In fact, the rate of job growth has slowed down a bit under Trump. In the 35 months of supposed “economic decay” before he took office, the economy added nearly 8 million jobs.
Unemployment — The president said the unemployment rate is the lowest in over half a century, which is true enough. It was 3.5% in December.
He was also correct when he said “the average unemployment rate under my administration is lower than any administration in the history of our country.” The average rate during Trump’s first 35 months is 3.9%, compared with an average monthly rate of 7.4% under Obama, 5.3% under George W. Bush and 5.2% under Bill Clinton.
But Trump claimed too much credit for that when he claimed this wouldn’t be true “if we hadn’t reversed the failed economic policies of the previous administration.” The fact is, the jobless rate was down to 4.7% by the time Trump took office — well below the historical norm of 5.6%, which is the median monthly rate for all the months since the start of 1948.
Women’s Unemployment Rate
Trump also claimed that the “unemployment rate for women reached the lowest level in almost 70 years.” That’s true. But, as with the overall unemployment rate, the unemployment rate for women has been trending down for nearly a decade.
The women’s rate had reached a 10-year low of 4.6% under President Obama in July, November and December of 2016. It dropped further under Trump, falling to 3.4% in April and again in September of 2019 — the lowest since September 1953. That’s almost 70 years, as Trump said.
As of December 2019, the women’s unemployment rate was 3.5% — 1.2 percentage points lower than what it was when Trump took office. Under Obama, the women’s unemployment rate declined 2.3 percentage points — from 7% in January 2009, during the Great Recession, to 4.7% in January 2017, when he left office.
USMCA
Trump claimed that the new trade agreement with Canada and Mexico “will create nearly 100,000 new high-paying American auto jobs.” But the U.S. International Trade Commission estimates the job gains at 28,000 over five years.
The U.S.-Mexico-Canada Agreement, which Trump signed into law Jan. 29, replaces the North American Free Trade Agreement. The Trump administration has estimated that it will create 76,000 automotive jobs over five years.
However, in its April 2019 analysis of the new trade deal, the USITC said that the Trump administration’s estimate is too high. The trade commission is “an independent, nonpartisan, quasi-judicial federal agency.”
“U.S. government officials who are familiar with USMCA negotiations and have access to aggregate data from vehicle manufacturers estimate that the impact of USMCA will be an increase of 76,000 vehicle and parts manufacturing jobs, and investments totaling $34 billion over five years,” the analysis said. “This estimate is larger than the Commission’s estimate, which predicts an increase of 28,000 jobs.”
The USITC also reviewed three independent analyses of the trade deal and found that two of them were “generally consistent” with the commission’s findings. A third — from the Center for Automotive Research — extended its analysis to include “impacts on downstream service employees (e.g., at dealerships), which concludes with a more negative result” than the USITC.
The commission said that one key difference between its estimate and the administration’s is in the area of auto manufacturing. The administration projects an increase in vehicle manufacturing jobs, while the commission “finds a decline due to decreased volume.”
“It’s not at all clear that there is going to be a positive effect on jobs in the auto industry,” Mary Lovely, a senior fellow at the Peterson Institute for International Economics, which produced one of the reports reviewed by the USITC, told the New York Times last year. “This is the hard lesson of economics, which is basically there’s a lot of factors here.”
Wages Have Gone Up Under Past Presidents
Trump was wrong when claimed: “After decades of flat and falling incomes, wages are rising fast.”
Wages have gone up under Trump, but they haven’t been “flat” for “decades.” Real wages, adjusted for inflation, have gone up over the last several presidencies.
During Obama’s last four years in office, the average weekly earnings for production and nonsupervisory workers went up 4.9%. Over his eight years in office, wages went up 4.2%.
Under President George W. Bush, wages also increased by 4.2%, and they rose by 6.4% under President Bill Clinton.
During Trump’s time in office, those wages have gone up by 2.6%.
These figures come from the Bureau of Labor Statistics. The long-term trend shows a U-shaped curve, not a flat line. Real wages hit their peak in the early 1970s, and then generally dropped before beginning to rise again starting in the mid-1990s.
Democratic Response Also Wrong on Wages
Michigan Gov. Gretchen Whitmer claimed in the Democratic response to the State of the Union: “In my own state, our neighbors in Wisconsin and Ohio, Pennsylvania and all over the country, wages have stagnated while CEO pay has skyrocketed.” As we explained, wages, adjusted for inflation, have been rising.
Whitmer has a point that wages for those at the top, over the long-term, have grown more rapidly than for those in lower-income groups. The Economic Policy Institute, a think tank that advocates for low- and middle-income workers, said in a 2019 report that every income percentile saw some growth in inflation-adjusted hourly wages from 1979 to 2018, though the 50th percentile saw a 14% increase while the 95th percentile experienced a 56.1% increase.
Household Income
Trump claimed that “real median household income is now at the highest level ever recorded.” That’s true by one inflation-adjusted measure, but not by another.
As we wrote in our latest update of “Trump’s Numbers,” the Census Bureau’s official measure of median household income reached $63,179 in 2018 – which is the highest ever recorded. But Census officials said recent figures are due in part to a change in the survey questions in 2014. Since then, the annual survey has included additional sources of income that were previously left out.
According to the “estimated adjusted” figures Census officials published to reflect the change, the median household income in 2018 was less than it was in 1999 – $63,231.
Stocks/401(k)s
Trump exaggerated the success of the stock market gains under his leadership, claiming, “Since my election, United States stock markets have soared 70 percent.” And, he said, “All of those millions of people with 401(k)s and pensions are doing far better than they have ever done before with increases of 60, 70, 80, 90, and 100% and even more.”
As we wrote recently in “Trump’s Numbers January 2020 Update,” stock prices continued their decade-long rise with Trump in office. But he is overstating that success, and he’s goosing the numbers a bit by taking credit for gains while Obama was still in office, but after Trump’s election.
At the close on Feb. 4, the Standard & Poor’s 500-stock average was 45.2% higher than it was on the day of Trump’s inauguration. Over the same period, the Dow Jones Industrial Average, made up of 30 large corporations, was up 45.3% under Trump. And the NASDAQ composite index, made up of more than 3,000 companies, was up 70.4%.
It’s certainly possible that some 401(k) plans have increased dramatically, even as high as 100%, as the president said. But those would be outliers. According to an analysis by Fidelity Investments, the average 401(k) balance increased about 1% between the first quarter of 2018 and the first quarter of 2019, and increased 8% between the first quarters of 2017 and 2018.
And as we have written, not everyone in the U.S. is enjoying the stock market gains. Only about half of U.S. households owned stocks directly or indirectly (through mutual funds, trust funds or pension plans) in 2016, according to a paper published in November 2017 by the National Bureau of Economic Research. And only about a third of Americans contribute to a 401(k), according to the U.S. Census.
Border Wall
Trump boasted that “as we speak, a long, tall, and very powerful wall is being built” along the southern border. “We have now completed over 100 miles,” he said.
The administration has improved the barriers along the southern border, but nearly all construction has been to replace existing barriers — not extend the length of the miles of physical barriers between the U.S. and Mexico.
As of fiscal year 2015, there were 654 miles of primary barriers on the southwest border, “including 354 miles of primary pedestrian barriers and 300 miles of primary vehicle barriers,” according to a July 2018 report by the Government Accountability Office. As of Jan. 24, U.S. Customs and Border Protection “has 655 miles of primary barriers on the southwest border,” according to a CBP fact sheet.
Under Trump, “approximately 99 miles of new border wall system [has been] constructed in place of dilapidated and/or outdated designs and approximately 1 mile of new border wall system constructed in locations where no barriers previously existed,” the fact sheet said.
In addition to those primary barriers, CBP said the administration has completed so far 10 miles of secondary barriers, which are located behind the primary barriers.
Border Apprehensions
Trump said “illegal crossings” at the southwest border “are down 75% since May.” But measured over a longer period of time, border apprehensions under Trump are up, not down.
Trump: As a result of our unprecedented efforts, illegal crossings are down 75% since May — dropping eight straight months in a row.
There are technically no statistics for those who cross the border illegally, but apprehensions by U.S. Customs and Border Protection are used to measure such trends.
Total southwest border apprehensions did decline by nearly 75% from 132,856 in May to 32,858 in December, according to CBP. But attempted border crossings tend to be highest in March, April and May and lowest in December.
As we wrote in “Trump’s Numbers January 2020 Update,” there were 799,669 total apprehensions at the southern border in 2019, the highest annual total since 2007 and 81% higher than in 2016, the year before Trump took office.
‘Factories’
Boasting about growth in manufacturing, Trump claimed: “After losing 60,000 factories under the previous two administrations, America has now gained 12,000 new factories under my administration.” But there’s less here than meets the eye.
He’s likely referring to Bureau of Labor Statistics data on the “Number of Establishments in Private Manufacturing,” which indicates there was a decline of 54,865 manufacturing “establishments” between the first quarter of 2001 and the first quarter of 2017. That was a roughly 13% decrease during the administrations of George W. Bush and Barack Obama. And there has been an increase of 12,074 of those establishments (3.5%) between the first quarter of 2017 and the second quarter of 2019, the last quarter for which such data is available.
However, some context is in order. The BLS counts all establishments “engaged in the mechanical, physical, or chemical transformation of materials, substances, or components into new products.” Although manufacturing establishments “are often described as plants, factories, or mills” — Trump called them “factories” — and “characteristically use power-driven machines and materials-handling equipment,” they also include “establishments that transform materials or substances into new products by hand or in the worker’s home and those engaged in selling to the general public products made on the same premises from which they are sold, such as bakeries, candy stores, and custom tailors.”
The figures also include all sizes of establishments, and when we looked into this claim in October, Caleb Foote at the Information Technology and Innovation Foundation noted that the vast majority of gains under Trump’s watch have been establishments with fewer than five employees.
Also, the upward trend began before Trump took office. In Obama’s last four years, the number of establishments grew by 10,407.
Health Insurance Premiums
The president compared apples to oranges in claiming, “Before I took office, health insurance premiums had more than doubled in just five years. I moved quickly to provide affordable alternatives. Our new plans are up to 60 percent less expensive and better.”
The administration had claimed a doubling of the “average premium” from 2013 to 2017, but, as we wrote, that compares individual market premiums before the Affordable Care Act’s major provisions went into effect with 2017 HealthCare.gov exchange premiums. The ACA required insurers to charge the same premiums, regardless of health status, and include a minimum set of benefits. So, cheap, barebones plans could no longer be offered to those who buy their own insurance.
Also, as we explained in detail, the Department of Health and Human Services report that included these estimates said there were several limitations and caveats, including relying on data for 2013 that HHS acknowledged wasn’t a “perfect comparison.”
As for the “affordable alternatives” Trump touted, his administration has issued rules to expand cheaper, less comprehensive insurance options, such as short-term insurance. Whether those plans would be “better,” as Trump claimed, would be a matter of opinion, as we’ve said before. They would cost less because they wouldn’t have to cover certain benefits and could vary premiums more widely than the ACA allows.
Not So ‘Iron-Clad’ on Preexisting Conditions
Trump said he made an “iron-clad” promise to Americans: “We will always protect patients with preexisting conditions.” But he has backed Republican health plans that would lessen the current protections for those with preexisting conditions, and his administration has supported a lawsuit against the Affordable Care Act by arguing the health law’s preexisting condition protections would have to be eliminated.
As we’ve explained, under the ACA, insurers can’t deny coverage or set premiums based on an individual’s medical conditions. The GOP health plans debated in 2017 and supported by Trump, however, could have caused some with health conditions to pay higher premiums. (See “Bloomberg, Trump Spar on Preexisting Conditions” for more.)
The Republican plaintiffs in the court case, Texas v. United States, say the entire ACA should be found unconstitutional. We don’t know what the administration would do regarding preexisting conditions if the plaintiffs ultimately win that case, but a 2018 Justice Department letter said that two provisions of the ACA would need to be eliminated if the suit were successful: those guaranteeing that people can’t be denied coverage by insurers or charged more based on certain factors, such as health status.
Energy
As he has done previously, Trump attributed the U.S.’s position as the top producer of oil and natural gas to his administration’s actions. “Thanks to our bold regulatory reduction campaign,” he said, “the United States has become the No. 1 producer of oil and natural gas anywhere in the world, by far.”
While energy production has risen under Trump, the hydraulic fracking boom that has propelled the U.S. to its current heights began under previous administrations — and some of the top rankings were hit years ago.
As we have written on other occasions when Trump has made similar claims, including in last year’s State of the Union, the U.S. outstripped Russia to become the world’s largest producer of natural gas more than a decade ago, in 2009.
According to the U.S. Energy Information Administration, the U.S. also took the top spot for petroleum production well before Trump was in office, in 2013. Total petroleum, EIA explains, is “made up of several different types of liquid fuels, including crude oil and lease condensate, tight oil, extra-heavy oil, and bitumen.”
Trump was president when the U.S. surpassed Russia on crude oil production in the summer of 2018. That achievement, however, was long expected, and based on a surge in crude that began about a decade ago. The International Energy Agency’s 2012 energy outlook, for example, predicted that the U.S. would become the largest crude oil producer by 2020, primarily because of advances in fracking technology.
Trump also claimed the U.S. was energy independent, saying, “With the tremendous progress we have made over the past three years, America is now energy independent.” While there isn’t necessarily a single definition for energy independence — and as a concept it may be impossible, given global markets — one metric would be whether the U.S. produces more energy than it consumes.
The latest monthly data from EIA, which is current up to October 2019, shows that for six out of the 10 months of last year, U.S. total primary energy production exceeded total consumption.
The U.S., however, still has energy imports.
Workforce
Trump made a puzzling and misleading claim when he said, “In eight years under the last administration, over 300,000 working-age people dropped out of the workforce. In just three years of my administration, 3.5 million people, working-age people, have joined the workforce.”
The fact is that the total civilian workforce grew during Obama’s eight years — adding 5.4 million. It has grown faster under Trump, adding 4.9 million during his first 35 months.
(The workforce is made up of those age 16 and over who are either employed or seeking employment.)
It’s not clear what Trump means by “working age.” If he meant to refer to workers in what is commonly called the “prime” working years of 25 to 54, then he would be correct to say there was a decline. But the loss was actually close to 1.6 million (not 300,000) during Obama’s time. And there has been a gain under Trump in this age group, but the figure is just under 2.5 million (not 3.5 million).
Sources
Bureau of Economic Affairs. “Gross Domestic Product, Fourth Quarter and Year 2019 (Advance Estimate).” News release. 30 Jan 2020.
Bureau of Labor Statistics. “Employment, Hours, and Earnings from the Current Employment Statistics survey (National); Total Nonfarm Employment, Seasonally Adjusted.” Data extracted 4 Feb 2020.
Wall Street Journal. “WSJ Economic Forecast Survey.” Jan 2020.
Bureau of Labor Statistics. “Labor Force Statistics from the Current Population Survey; Unemployment Rate, Seasonally Adjusted.” Data extracted 4 Feb 2020.
Bureau of Labor Statistics. “Labor Force Statistics from the Current Population Survey; Civilian labor force, 16 years and over.” Data extracted 4 Feb 2020.
Bureau of Labor Statistics. “Labor Force Statistics from the Current Population Survey; Civilian labor force level – 25 to 54 years.” Data extracted 4 Feb 2020.
U.S. International Trade Commission. “U.S.-Mexico-Canada TradeAgreement: Likely Impact on the U.S. Economy and on Specific Industry Sectors.” Apr 2019.
White House. “Remarks by President Trump at a Signing Ceremony for the United States-Mexico-Canada Trade Agreement.” 29 Jan 2020.
U.S. Office of the Trade Representative. “USMCA Estimated to Support 76,000 Additional American Auto Jobs, Billions in New Auto Manufacturing Investments.” 18 Apr 2019.
Chokshi, Niraj. “Unions Skeptical Trump’s Trade Deal Will Bring Back Auto Jobs.” New York Times. 11 Dec 2019.
Bureau of Labor Statistics. “Labor Force Statistics from the Current Population Survey; Women Unemployment Rate, Seasonally Adjusted.” Accessed 4 Feb 2020.
Rothbaum, Jonathan and Edwards, Ashley. “U.S. Median Household Income Was $63,179 in 2018, Not Significantly Different From 2017.” U.S. Census Bureau. 10 Sep 2019.
U.S. Census Bureau. “Current Population Survey, 1966 to 2019 Annual Social and Economic Supplements.” 10 Sep 2019.
U.S. Government Accountability Office. “Southwest Border Security. CBP Is Evaluating Designs and Locations for Border Barriers but Is Proceeding Without Key Information.” Jul 2018.
U.S. Customs and Border Patrol and U.S. Army Corps of Engineers. “Border Wall Status. As of January 24, 2020.” 24 Jan 2020.
Jackson, Brooks. “Trump’s Numbers January 2020 Update.” FactCheck.org. 20 Jan 2020.
U.S. Border Patrol. “U.S. Border Patrol Southwest Border Apprehensions FY 2020.” 9 Jan 2020, accessed 4 Feb 2020.
U.S. Border Patrol. “U.S. Border Patrol Southwest Border Apprehensions FY 2019.” 14 Nov 2019, accessed 4 Feb 2020.
U.S. Border Patrol. “Total Illegal Alien Apprehensions By Month Fiscal Years 2000-2018.” Mar 2019, accessed 4 Feb 2020.
EIA. January 2020 Monthly Energy Review. 28 Jan 2020.
Kiely, Eugene et. al. “FactChecking the State of the Union.” FactCheck.org. 6 Feb 2019.
Robertson, Lori et. al. “Trump’s Campaign Kickoff Claims.” FactCheck.org. 19 Jun 2019.
Kiely, Eugene. “FactChecking Trump’s Energy Boasts.” FactCheck.org. 8 Jun 2018.
Neuhauser, Alan. “U.S. Nears ‘Energy Independence’.” U.S. News & World Report. 19 July 2019.
Gjelten, Tom. “Energy Independence For U.S.? Try Energy Security.” NPR. 12 Oct 2012.
EIA. “United States remains the world’s top producer of petroleum and natural gas hydrocarbons.” 21 May 2018.
EIA. “The United States is now the largest global crude oil producer.” 12 Sep 2018.
EIA. “U.S. monthly crude oil production exceeds 11 million barrels per day in August.” 1 Nov 2018.
EIA. “The United States now exports crude oil to more destinations than it imports from.” 22 Oct 2019.
Yahoo! Finance. “Dow Jones Industrial Average.” Accessed 4 Feb 2020.
Yahoo! Finance. “S&P 500.” Accessed 4 Feb 2020.
Yahoo! Finance. “NASDAQ Composite.” Accessed 4 Feb 2020.
Fidelity Investments. “Fidelity Q1 2019 Retirement Analysis: Account Balances Rebound from Dip in Q4, While Savings Rates Hit Record Levels.” 9 May 2019.
Fidelity Investments. “Fidelity Announces Q1 2018 Retirement Data: Saving Rates Hit Record High and Account Balances Continue to Increase Over Long-Term.” 17 May 2018.
Wolff, Edward. “Household Wealth Trends in the United States, 1962 to 2016: Has Middle Class Wealth Recovered?” National Bureau of Economic Research. Nov 2017.
Dressel, Edward. “U.S. Census Research Reveals Horrible 401(k) Statistics.” Retire Ready Solutions. Accessed 4 Feb 2020.
U.S. Bureau of Labor Statistics. Quarterly Census of Employment and Wages. Number of Establishments in Private Manufacturing for All establishment sizes in U.S. TOTAL, NSA. Accessed 4 Feb 2020.
U.S. Bureau of Labor Statistics. “About the Manufacturing sector.” Accessed 4 Feb 2020.