Para leer en español, vea esta traducción de Google Translate.
The official U.S. poverty rate in 2022 “remained stable compared to 2021,” but an alternative method of measuring poverty “increased significantly, reflecting changes in economic well-being following the end of many pandemic-era programs,” the Census Bureau says in a new report.
But a chart former President Donald Trump shared on social media — comparing a decline in poverty during his presidency with an increase in poverty during President Joe Biden’s — leaves out important context that readers need to know.
First, Trump’s chart uses poverty rates based on the Supplemental Poverty Measure, or SPM, which the U.S. Census Bureau calculates using a different methodology than that used to determine the official poverty rate. Under Biden, there was no increase in the official poverty rate, as of 2022, which is the Census Bureau’s most recent estimate.
Furthermore, the supplemental poverty rate went down in 2020 and 2021 mainly because of economic relief, such as stimulus payments, unemployment benefits and tax credits, that was made available to qualifying individuals and families during the COVID-19 pandemic. Without that same financial aid in 2022, the supplemental poverty rate went up.
Biden has proposed extending at least the expanded child tax credit that expired at the end of 2021. Doing that would lift millions out of poverty, the Census Bureau said.
Poverty Rates
Without any further explanation, Trump posted this chart to Truth Social on Oct. 16. (We added the “missing context” stamp for readers.)
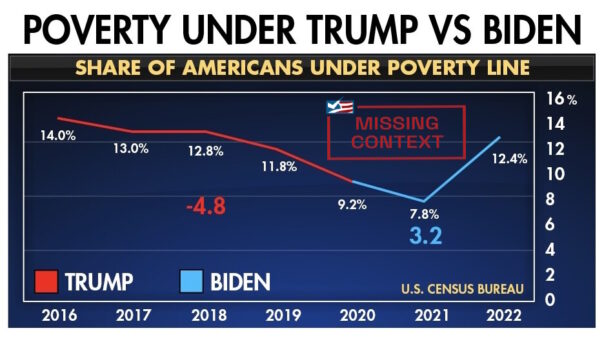
The chart does not say it, but the figures, which show the poverty rate declining by 4.8 percentage points under Trump and increasing 3.2 percentage points under Biden, are based on the Census Bureau’s Supplemental Poverty Measure.
The SPM, introduced in 2011, is one of two poverty metrics the bureau publishes annually in September. The other, known as the official poverty measure, was developed in the 1960s.
Unlike the official poverty rate, which is based on an individual’s or family’s pretax cash income, the SPM is determined, in part, by cash income plus other noncash benefits. The latter includes government transfers or programs that help low-income individuals and families, such as food, housing and energy assistance, as well as tax credits and stimulus payments. In addition, the SPM calculation considers nondiscretionary expenses, such as taxes and medical care, and accounts for regional differences in the cost of living.
There are criticisms of both metrics, but many who study poverty prefer the Supplemental Poverty Measure because of its more comprehensive measurement of a person’s or family’s financial resources.
As Trump’s chart shows, the SPM rate declined from 14% in 2016, before Trump took office in 2017, to 9.2% in 2020, his last full year as president. From there, the rate dropped to 7.8% in 2021, the first year of the Biden administration, and then jumped up to 12.4% in 2022, as COVID-19 relief funding dried up.
Meanwhile, the official poverty rate went down from 12.7% in 2016 to 11.5% in 2020. After that, the rate increased slightly to 11.6% in 2021, before returning to 11.5% in 2022.
Poverty Increase, Explained
But the chart Trump shared with his followers leaves out the reason for the increase in the supplemental poverty rate last year.
“The trend in the SPM poverty rates is statistically accurate, though context here is needed,” Zachary Parolin, an assistant professor of social policy at Bocconi University in Milan, Italy, told us when we asked about the graphic in Trump’s Truth Social post.
In an email, Parolin, who is also a senior research fellow at Columbia University’s Center on Poverty and Social Policy, wrote that the lower supplemental poverty rates in 2020 and 2021 could be attributed “entirely” to “COVID-related income support” included in the Coronavirus Aid, Relief, and Economic Security Act and the American Rescue Plan Act, which became law in those years, respectively.
“Both include expansions to unemployment benefits and a stimulus check,” and 2021’s American Rescue Plan, which passed without any Republican support, “also included the expanded Child Tax Credit, which contributed to lower poverty that year,” Parolin said.
That is supported by the Census Bureau’s poverty reports for 2020 and 2021, which noted that economic impact payments, expanded unemployment benefits and tax credits authorized in those years helped keep tens of millions of people out of poverty.
But when that financial support was no longer available in 2022, poverty, according to the SPM, increased.
As the Census Bureau said in its report for 2022: “The official poverty rate remained stable compared to 2021, while the SPM rate increased significantly, reflecting changes in economic well-being following the end of many pandemic-era programs. SPM estimates for 2022 reflect changes to state and federal income taxes, including several one-time state income tax rebates and the expiration of expanded refundable tax credits and economic impact (stimulus) payments enacted as part of the American Rescue Plan Act.”
Rising inflation also affected the level of poverty in 2022, “but its contribution was smaller than the contribution of declining COVID-era benefits,” Parolin said.
When the report on poverty was released in September, it noted that children were most affected by expiring benefits last year. Biden issued a statement blaming Republicans and promising to push for Congress to restore the expanded child tax credit that phased out at the end of 2021.
The Census Bureau said that the fully refundable child tax credit had prevented about 5.3 million children from falling into poverty in 2021, “over twice as many” as the 2.4 million people helped by the pared back version in 2022.
Republicans opposed previous efforts by Democrats to extend the tax credit. The American Rescue Plan had increased the credit from $2,000 to $3,600 for qualifying children ages 5 and younger and to $3,000 for qualifying children ages 6 to 16, extended the credit to 17-year-olds, and made the credit fully refundable, meaning the full credit was available even if a family didn’t owe any taxes.
Editor’s note: FactCheck.org does not accept advertising. We rely on grants and individual donations from people like you. Please consider a donation. Credit card donations may be made through our “Donate” page. If you prefer to give by check, send to: FactCheck.org, Annenberg Public Policy Center, P.O. Box 58100, Philadelphia, PA 19102.