In recent weeks, President Donald Trump has made a series of claims about the economy, a topic that should feature prominently in his State of the Union address to Congress on Feb. 24.
“We have the hottest country anywhere in the world,” Trump said at a White House press briefing on Jan. 20, adding later that “America is booming.” He made similar comments the following day, asserting that “we were a dead country” a year ago.
But his economic boasts include false or misleading claims, and he sometimes pushes an incorrect narrative of an abrupt change in some economic indicators since he came back to the White House.
As preparation for what we might hear in Tuesday night’s speech, we offer a guide to a dozen of Trump’s recent claims about the economy, most of which we’ve written about before. They touch on inflation, economic growth, manufacturing, wages, jobs, the deficit, stock market and more.
Economic Growth
Proud of federal data showing that economic growth in the second and third quarters of 2025 exceeded expectations, Trump in Iowa on Jan. 27 falsely claimed that “under my leadership, economic growth is exploding to numbers unheard of. They’ve never had them before.”
After declining by an annualized rate of 0.6% in the first quarter of 2025, which covers the three months from January to March, real gross domestic product (meaning it has been adjusted for inflation) grew at a rate of 3.8% in the second quarter of 2025 and at a rate of 4.4% in the third quarter, according to estimates from the Bureau of Economic Analysis.
But those were not record-setting numbers. They were the largest quarterly increases since the economy expanded at a rate of 4.7% in the third quarter of 2023, under President Joe Biden.
As we wrote this month, the quarterly growth record is 34.9% in the third quarter of 2020, which was at the beginning of the economic recovery during the COVID-19 pandemic. Prior to the pandemic, according to BEA estimates back to 1947, the record was 16.7% growth in the first quarter of 1950. Yearly growth in GDP has averaged about 2.75% over the last 50 years.
Jobs
Trump told NBC News in a Feb. 4 interview: “We have, it was just announced, more jobs right now occupied in the United States of America than at any time during its existence, 250 years. There are more people working today than at any time in the history of our country. Pretty good stat.”
While accurate, the statistic loses some luster when factoring in steady U.S. population growth. In fact, job growth slowed and the employment-to-population ratio declined a bit in the first year of Trump’s second term.
According to the Bureau of Labor Statistics, there were 158,627,000 people employed in the U.S. in January, and that’s the highest number on record. But by and large, as the population of the U.S. has grown over the years, so too has the number of people employed in the U.S., with notable exceptions during recessions. This graph from BLS gives the long-term picture:
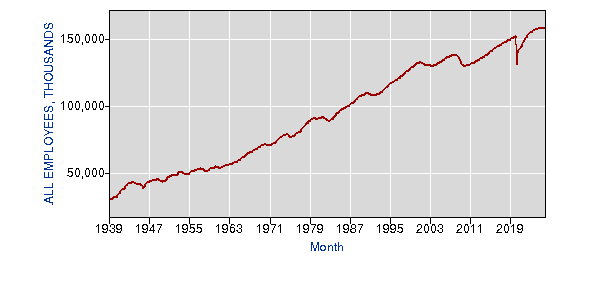
Since employment recovered from the COVID-19 pandemic in mid-2022, jobs have reached new highs nearly every single month. Trump’s claim also overlooks that job growth was lower between January 2025 and January 2026 under Trump — a gain of 359,000 jobs or 0.2% — than it was for Biden’s final year — a gain of 1.2 million jobs or 0.8.%.
There are other, more relevant statistics, on employment growth that factor in population growth. BLS’ employment-population ratio, which is the percentage of the population that is working, declined from 60.1% in January 2025 to 59.8% in January 2026. Another measure is the labor force participation rate, which is the percentage of the total population over age 16 that is either employed or actively seeking work. That rate has stayed relatively the same, going from 62.6% in January 2025 to 62.5% in January 2026. The so-called “prime age” labor force participation rate, focusing just on those ages 25 to 54, rose from 83.5% in January 2025 to 84.1% in January 2026.
Trump has frequently cited this hollow statistic about more people being employed than ever before during both his first and second terms, including during his State of the Union address in 2019.
Inflation
In the NBC News interview, Trump repeated his false claim that he “inherited the worst inflation in the history of our country,” and added that “now we have almost no inflation.”
When Trump took office in January 2025, the annualized rate of inflation was 3%, based on the Consumer Price Index. That was far from the 9.1% rate in June 2022, under Biden, which was the highest 12-month increase since November 1981, according to the Bureau of Labor Statistics. The worst inflation in U.S. history was not long after World War I, when the Consumer Price Index was up 23.7% for the 12 months ending in June 1920.
Trump has repeatedly mocked Democrats for raising the issue of “affordability,” which Trump says he has since solved.
“Prices are way down. You don’t hear the Democrats talking about affordability anymore, which they caused the affordability problem, very badly,” Trump said on Feb. 6. “But you don’t hear that word. I haven’t heard that word spoken in a week and a half because they can’t speak because the prices are down.”
But overall prices are not down. As of January, one year into Trump’s second term, the annual inflation rate was down to 2.4%. However, that’s above the 2% target set by the Federal Reserve. So, prices are still increasing, but at a slower pace than when Trump took office.
Stagflation
In the Jan. 20 press briefing at the White House, Trump falsely claimed to have “ended Biden stagflation,” which he said is “far worse than inflation.” The U.S. was “plagued by the nightmare of stagflation” under Biden, and now “we are witnessing the exact opposite,” Trump said at a World Economic Forum meeting on Jan. 21.
But, as we’ve written, economists told us that the U.S. economy under Biden did not experience stagflation, which Kyle Handley, a professor of economics at the University of California, San Diego, told us “refers to a sustained period of high inflation combined with weak or stagnant real economic growth, typically alongside rising unemployment.” He said that definition did not apply to the Biden economy.
Inflation was high during Biden’s first two years in office, then declined sharply in the last half of his presidency. “However, real GDP growth during the Biden presidency was positive and often above trend, and unemployment remained historically low,” Handley said.
In addition, Aeimit Lakdawala, an associate professor of economics at Wake Forest University, told us that there has not been a complete economic turnaround under Trump.
“What we’re really seeing is a continuation of trends that were already well underway before Trump took office in January 2025,” Lakdawala said. He noted that the annual inflation rate is “modestly lower” under Trump, while the average annualized increase in real GDP under Trump is “a touch lower” than in Biden’s last two years. The unemployment rate, at 4.3% as of January, is also slightly higher than it was when Trump took office.
Stock Market
Trump has repeatedly boasted that the stock market has outperformed expectations. “Your 401(k)s are doing very well,” Trump said in a speech to military families in North Carolina on Feb. 13.
A Feb. 16 press release from the White House put some additional spin on the claim, saying the stock market has “rebounded strongly under President Trump’s leadership.” The release notes that the S&P 500 “surg[ed] nearly 40% from its early-year low.” That’s true. But the low in 2025 came just a few days after Trump’s so-called “Liberation Day” tariff announcement on April 2 that sent stock prices tumbling. Since then, stocks have rebounded and achieved new highs.

Since Trump took office, the S&P 500 has risen 14.5% (that’s for the period between the close of the market on Jan. 17, 2025, the last business day before the inauguration, and the close of the market on Feb. 18, 2026). Although Trump has said stocks far outperformed Wall Street expectations, that’s only a little better than many financial analysts forecast for 2025 just before Trump took office.
As Yahoo! Finance wrote on Jan. 2, 2025, “The median year-end target for the S&P 500 among strategists tracked by Yahoo Finance sits at 6,600. This would represent about a 12% increase from the index’s current level.”
“And if you remember when I was first elected, everybody said, if I got it to 50,000, the Dow, or 7,000 with the S&P, if I got it to 50,000 with a Dow, that would be an amazing — that would be in four years from then, from the election,” Trump told reporters on Feb. 13.
The Dow Jones Industrial Average, made up of 30 large corporations, reached 50,000 in early February, but has since dropped a bit, and was at 49,576 at the open of the market on Feb. 19.
But it’s misleading to suggest the stock market “rebounded strongly” under Trump. The stock market performed well in Biden’s final two years in office — with the S&P 500 rising over 20% each of those years — better than the 13% gain Trump saw in his first year. As we wrote in our story, “Biden’s Final Numbers,” the S&P 500 grew by nearly 58% over the entirety of Biden’s four years. The stock market has been on a good long-term run, with the S&P rising nearly 68% during Trump’s first four years in office and by 166% during the eight years under President Barack Obama before that.
We also note that while Trump often boasts that everyone’s 401(k) retirement account has risen, only about 62% of Americans own any stock, according to a Gallup poll in 2025. Ownership of stock skews heavily to the wealthy — 87% among those in households earning at least $100,000. It was 28% among those in households earning less than $50,000.
Gasoline Prices
In a Feb. 6 gaggle with reporters, in which he claimed that “[w]e’ve had massive price reductions,” Trump misleadingly said that “[i]f you look at gasoline, $1.99 a gallon.” That was far from the national average price.
Gasoline prices are about 19 cents (or 6%) lower than they were when Trump took office, but, as of the week ending Feb. 9, the average price in the U.S. for a gallon of regular gasoline was $2.90, nearly $1 more than Trump said, according to the Energy Information Administration. One week later, the average price was $2.92, as of the week ending Feb. 16.
There also were no states in which the average price was below $2 at the time of Trump’s claim. Oklahoma had the lowest average price at $2.36 per gallon on Feb. 6, according to AAA data. That state, at $2.29, also had the lowest average price on Feb. 18.
Patrick De Haan, head of petroleum analysis at GasBuddy, told us in an email that, as of Feb. 14, there were “about 40 stations in the nation with gasoline below $2/gal, which is what we’ve generally seen on a daily basis for February thus far.” In a Feb. 16 post on Substack, he wrote that, as of that date, $2.79 was the “most common U.S. gas price encountered by motorists.”
Energy and Grocery Prices
In a Jan. 27 press gaggle, Trump also claimed to have “made a lot of progress” on the “very, very high prices” that he inherited. “So, we have the groceries going down. We have the energy going down,” he said. That’s misleading.
While the average price of some grocery items, such as eggs and bread, has decreased since the start of Trump’s second term, average food prices overall are up — not down. As of January, the Consumer Price Index for at-home food products purchased at a grocery store or supermarket had increased about 2.2%, year over year, according to the most recent BLS data.
As for energy prices, it’s not clear what Trump is referring to. The CPI for energy overall was down 0.3% for the 12 months ending in January, while the index for household energy specifically rose 6.6% in that period, according to BLS data. Also, the average price of electricity per kilowatt hour has risen about 7.3% in the last year.
Budget Deficit
In his Jan. 30 opinion piece for the Wall Street Journal, Trump exaggerated when he wrote that “with the help of tariffs, we have cut that federal budget deficit by a staggering 27% in a single year.”
Budget deficits occur when federal spending exceeds revenue. The White House has said that Trump’s figure was calculated by comparing the cumulative budget deficit from February to November in 2025 with the combined deficit for the same 10 months in 2024.
But organizations that track the budget deficit typically compare deficits based on months in fiscal years, not calendar years. The $1.78 trillion budget deficit for fiscal year 2025, which began on Oct. 1, 2024, and ended on Sept. 30, decreased about 2.3% from the $1.82 trillion budget gap in fiscal year 2024. (Trump alone was president for a full eight out of the 12 months in FY 2025.)
As of January, the budget deficit was down about 17% through the first four months of FY 2026 when compared with the same period in FY 2025. An increase in federal revenue, including from tariffs, contributed to the decline. On Feb. 9, the Congressional Budget Office said, “Customs duties, including tariff revenues, collected this year were more than four times the amount recorded in the first four months of last year, an increase of $90 billion.”
However, in its most recent long-term budget outlook, the CBO projected that the final FY 2026 budget deficit will end up being close to $1.9 trillion, higher than the deficit in FY 2025. That would be about $140 billion higher than the deficit that CBO projected for FY 2026 in January 2025, before any of Trump’s policies had been implemented.
Trade Deficit
Trump’s claim that he has “slashed our gaping trade deficit by a staggering 77%,” as he said Jan. 27 in Iowa, is misleading. In 2025, the U.S. trade deficit in goods and services decreased by 0.2%, or about $2.1 billion, from 2024, according to data the Bureau of Economic Analysis released Feb. 19. The 2025 goods-and-services trade deficit of roughly $901.5 billion was the third largest going back to 1960.
Instead, as we wrote on Feb. 3, Trump’s claim appears to compare the monthly trade deficit in January 2025 to the deficit nine months later in October, a 16-year low. That’s a decrease of 77.6%, according to BEA figures revised this month. (The decrease from January to December was 45.2%.) But economic experts told us that comparing the trade deficit in one month to another is not preferable because monthly trade figures can be volatile.
For instance, in the first three months of 2025, the trade imbalance surged to between roughly $120 billion and $136 billion, as U.S. importers loaded up on foreign goods to get ahead of tariffs on imported products that Trump had proposed. Imports went back down after the tariffs went into effect, producing smaller trade deficits in the months later in the year.
“Large month-to-month swings are common, even in periods with no underlying structural change in trade policy or economic conditions,” Handley, at the University of California, San Diego, said in an email for our story. “For that reason, economists almost never evaluate claims about the ‘trade deficit’ based on comparisons between two individual months.”
Manufacturing Construction
Trump has repeatedly claimed that “factory construction is up by 41%” under his second term. That’s misleading. The Census Bureau’s manufacturing construction spending data, which the White House referred us to, shows that spending has declined since Trump took office.
The quarterly data show a 6.7% decline, while the drop was 7.3% on a monthly basis, from January 2025 to October, the latest data available.
As we’ve explained, the White House gets a 41% increase by comparing the monthly average from January to August 2025 with the yearly average for 2021 to 2024. But that methodology fails to take into account the 212% increase in factory construction spending over Biden’s four years, partly fueled by the 2022 CHIPS Act, which helped fund semiconductor manufacturing facilities and continues to affect construction spending. Anirban Basu, chief economist for the Associated Builders and Contractors, an industry trade association, told us that the manufacturing construction spending in 2025 is “largely due” to the CHIPS Act.
It’s worth noting that the economy lost 83,000 manufacturing jobs in Trump’s first 12 months. In the year before he took office, the decline was 202,000 jobs, according to the Bureau of Labor Statistics.
Real Wages
Trump has repeatedly mentioned the decline in real wages, meaning they are adjusted for inflation, over the four years of Biden’s presidency and the increase in real wages so far under his second term. It’s true that real average weekly earnings fell 4%, according to the Bureau of Labor Statistics, during Biden’s term, and they’ve gone up 1.9% in the year since January 2025. But Trump at times has left the misleading impression that this has been an abrupt turnaround. Over Biden’s last year, real wages went up 0.7%
On Jan. 13, Trump said: “After real wages plummeted by $3,000 under sleepy Joe Biden, real wages are up by $1,300 in less than one year under President Trump.” Later that month, he said that “wages have gone up … much faster” than inflation. With Biden, he said, “it was just the opposite. Wages in the United States in the last year have gone up.”
Wages rose faster than inflation over the last year-and-a-half of Biden’s presidency. They’ve outpaced inflation since June 2023, and they’ve continued to do so since Trump took office.
“It remains the case that both at the tail end of the Biden administration and the beginning of this Trump administration, real wages have been rising. That is to say, inflation has been rising more slowly than wages have been,” Gary Burtless, a senior fellow emeritus in economic studies at the Brookings Institution, told us in a phone interview when we wrote about this topic in December.
As for the specific dollar amounts Trump has mentioned — a $3,000 decline in real wages under Biden and a $1,300 increase under his term — the White House told us that’s based on weekly wage data from BLS that’s adjusted for inflation using the CPI-W, which is the consumer price index for urban wage earners and clerical workers. It measures the change in prices for a basket of goods purchased by such workers, and it’s the index Social Security uses to calculate cost-of-living adjustments. Using that method, we got a decline of nearly $2,900 over Biden’s four years and an increase of about $1,400 for Trump’s first year ($1,363 to be exact), a figure that includes January data released this month.
Josh Bivens, chief economist at the Economic Policy Institute, a liberal-leaning think tank, cautioned against looking at wage growth only over presidential terms, calling it “deeply misleading” because “macroeconomic cycles occasionally have huge effects that have nothing to do with presidential performance.”
Bivens noted that average wages jumped up during the COVID-19 pandemic when the unemployment rate also spiked as mainly low-wage workers lost their jobs. As those low-wage workers regained employment, “it had the effect of artificially lowering measured wages in the aggregate.” (Burtless also said the pandemic had this impact on wage data.)
“The lesson is that the proper way to measure macroeconomic variables like average wages is from business cycle peak to business cycle peak, not from the trough to a peak. That’s why, for example, we measure from 2019-2024 or 2025,” Bivens said.
But presidents of both parties are apt to take credit or cast blame for increases or declines in real wage growth.
Investments
The president continues to make the exaggerated boast that “we secured commitments for a record breaking plus $18 trillion” in “new investments,” as he said in Iowa in late January. In his pre-Super Bowl NBC News interview, Trump also made the claim, saying “$18 trillion is being invested in our country as we speak.” At times, he has attributed this to his policies on tariffs.
A White House website tallying such promises puts the total at $9.6 trillion for “U.S. and Foreign Investments,” providing very few details on these agreements. But as we’ve written before, even that number is shaky because it includes pledges and planned investments that may not happen.
“[T]hey’re just promises — and often vague ones at that,” Scott Lincicome, vice president of general economics at the libertarian Cato Institute, said in an April 2025 analysis when Trump began making such claims.
In looking at the White House list in May, we found that some investments may not be due to Trump. A $500 billion artificial intelligence infrastructure project, for example, was reportedly in the planning stages in March 2024, well before the election. And both a labor union and a Democratic governor took credit for the announced reopening of an auto assembly plant that also was on the Trump administration’s list.
Editor’s note: FactCheck.org does not accept advertising. We rely on grants and individual donations from people like you. Please consider a donation. Credit card donations may be made through our “Donate” page. If you prefer to give by check, send to: FactCheck.org, Annenberg Public Policy Center, P.O. Box 58100, Philadelphia, PA 19102.