Summary
Since President Barack Obama first took office:
- The economy has added nearly 10.7 million jobs.
- Median household income has gone up $1,140, or 2 percent.
- The buying power of the average worker’s weekly paycheck is up 4.2 percent.
- Median sales prices of existing single-family homes are up 23 percent.
- The unemployment rate has dropped well below the historical norm; job openings are at a 15-year high.
- Corporate profits and stock prices have both soared to record highs.
- The number of people lacking health insurance has gone down by 16.5 million.
- The murder rate is down nearly 5 percent, despite an increase in 2015.
- The number of unauthorized immigrants estimated to be living in the U.S. is down, according to demographers.
- Wind and solar power have quadrupled; coal production has dropped 36 percent; carbon emissions have gone down 12 percent.
- However, the poverty rate is still 0.3 percentage points higher, and the number of Americans on food stamps is up nearly 36 percent.
- Federal debt has more than doubled, and annual federal deficits, after shrinking, are again on the rise.
- The home ownership rate has dropped to the lowest point in more than 50 years.
- Handgun production has more than doubled.
Those are just some of the findings in our latest installment of Obama’s Numbers.
Analysis
As we do every three months, we offer here a fresh update of selected statistical indicators of what has happened since Barack Obama first took the oath of office in January 2009. We leave it to our readers to judge how much credit or blame the president deserves for what has happened on his watch, and we caution that no single number or collection of numbers can tell the entire story. What we offer here are some key yardsticks from sources we consider solid and reliable.
Jobs & Unemployment
Number of Jobs — The economy has added another 572,000 jobs since we published our last report in July. As of September, total nonfarm employment stood 10,694,000 higher than when Obama first took office.
That nearly 10.7 million gain is less than half the nearly 23 million jobs gained during the booming years of Bill Clinton’s presidency, but far greater than the 1.3 million added during President George W. Bush’s eight years, which were plagued by two recessions.
Unemployment Rate — Meanwhile the unemployment rate has ticked up since our last report to 5.0 percent in September. It had dropped even lower — to 4.7 percent — in May, and has been at or below 5 percent for the past 12 months. That’s well below the historical norm: In all the months between 1948 and the time Obama took office, the median jobless rate was 5.5 percent.
The rate is now 2.8 percentage points lower than it was in January 2009, when the president first took office, and half what it was at the worst of the 2007-2009 recession, when the rate peaked at 10 percent within months of Obama entering office.
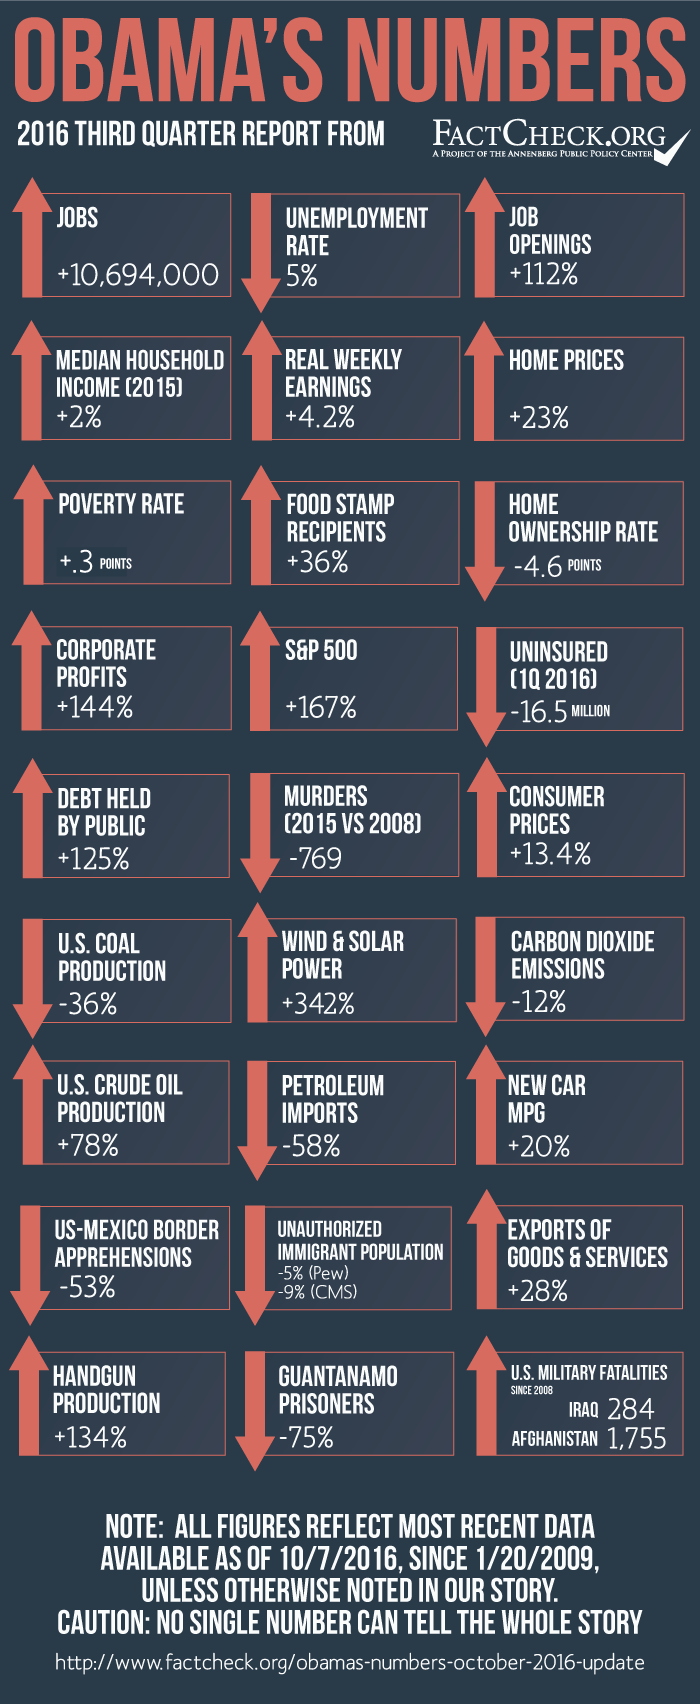
Job Openings — The number of job openings has more than doubled under Obama, to record levels.
As of the last day of July, the number of job openings reached 5,871,000. That’s the highest in the more than 15 years the Bureau of Labor Statistics has been tracking it.
It is also 112 percent more than in January 2009. The number of job openings now has exceeded 5 million for 18 consecutive months.
Labor Participation Rate — Meanwhile the labor force participation rate ticked up to 62.8 percent in September.
That rate, which is the portion of the entire civilian population age 16 and older that is either employed or currently looking for work, is now 2.8 percentage points lower than when Obama took office. That decline is due mostly to the post-World War II baby boomers reaching retirement age, and other demographic factors.
Long-term Unemployment — The number of long-term unemployed — those who have been looking for work for 27 weeks or longer — remained at just below 2 million in September. The number was 725,000 fewer than when the president first took office, but still 650,000 higher than in December 2007, at the start of the Great Recession.
The average length of unemployment also remains far above pre-recession levels. On average, those who were unemployed in September had been without work for 27.5 weeks. That’s 10.9 weeks longer than at the start of the recession.
Income and Poverty
Household Income — Since our last report, the Census has released annual figures on income and poverty covering 2015. They show that after a bleak five years, middle-income households were finally bringing in more money last year than they were the year before Obama entered office.
Median household income last year jumped up 5.2 percent, to $56,516, Census reported. That was the largest percentage increase in 17 years.
In “real” income, adjusted for inflation, that was $1,140 more than in 2008 — an increase of 2 percent under Obama. But 2015 was the first year of Obama’s administration when the median income was above the year before he took office.
And it will take even more gains to restore annual median incomes to earlier highs. The 2015 figure is still 2.4 percent below the peak year of 1999, and 1.6 percent below the level of 2007, when the worst recession since the Great Depression started in December.
Poverty — With incomes rising, millions escaped from poverty last year. Census reported that 43.1 million people were in poverty — 3.5 million fewer than in 2014.
The poverty rate — the percentage of the population living in poverty — went down to 13.5 percent. That was a decline of 1.3 percentage points, the biggest drop in the poverty rate in 16 years.
But that still left 3.3 million more people in poverty last year than in 2008. And the official poverty rate was still 0.3 percentage points above where it stood the year before Obama first entered the White House.
Real Weekly Earnings — The recovering economy, coupled with modest increases in prices, has boosted the buying power of weekly paychecks since Obama took office, especially in the last two years.
The BLS measure of average weekly earnings for all workers, adjusted for inflation and seasonal factors, was 4.2 percent higher in August than it was when Obama first took office.
Most of that gain is recent. Real weekly wages are up 2.8 percent in the most recent 24 months.
Those figures include salaried managers and supervisors. But the gains have been even larger for rank-and-file workers. The BLS measure of inflation-adjusted average weekly earnings for production and nonsupervisory employees was 4.6 percent higher in August than when Obama first entered the White House.
Consumer Prices – Overall price inflation during Obama’s time in office has been less than half the historical average.
The average yearly rise in the Consumer Price Index under Obama has been just 1.7 percent, measured from December to December. That’s well under half the post-World War II average, according to BLS figures. From 1946 to 2008, the average December-to-December rise in the CPI was a bit more than 4 percent.
And inflation has slowed even as the economy has warmed up. In the most recent 12 months on record, ending in May, the CPI rose less than 1.1 percent.
For the first seven years and seven months of Obama’s time in office, the CPI has gone up by only 13.4 percent. In the eight years of the Bush administration, the CPI went up 20.7 percent.
Health Insurance
Annual Census figures also confirm that the number of people who lacked health insurance dropped again last year, the second full year that the main provisions of the Affordable Care Act were in effect. According to Census, people who lacked coverage for all of last year declined to 29 million from 33 million the previous year — a difference of 4 million.
The percentage of people who lacked insurance dropped to 9.1 percent, down from 10.4 percent in 2014, according to Census.
But the most recent Census figures can’t be compared with years prior to 2013, because Census changed the way it gathers such data that year.
So to gauge how coverage has changed during Obama’s entire tenure, we turn to the National Health Interview Survey conducted by the Centers for Disease Control and Prevention. Besides keeping a consistent methodology, the NHIS has the added virtue of being conducted quarterly, and so is more up-to-date than the annual Census figures.
During the first three months of this year, 27.3 million people lacked coverage at the time they were interviewed, according to the most recent NHIS data. That’s down from 43.8 million during all of 2008, a drop of 16.5 million people since Obama first took office.
The recent drop is even more dramatic when considering that the number who lacked coverage jumped up to 48.6 million in 2010, as many who lost jobs during the recession and its aftermath also lost employer-sponsored coverage for themselves and their family members. The drop in the number of uninsured since 2010 is 21.3 million.
According to the NHIS, 14.7 percent of all people in the U.S. lacked health insurance at the time they were interviewed in 2008, and that number peaked at 16 percent in 2010. But it was down to 8.6 percent in the first quarter of 2016.
Profits & Markets
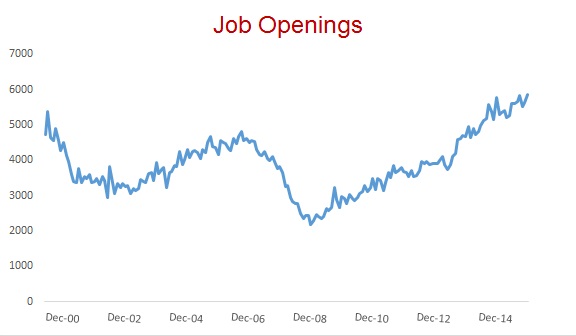
Corporate Profits — Corporate profits have risen robustly under Obama.
After-tax corporate profits hit a record $1.73 trillion in 2014, dipped to $1.58 trillion last year, and were running at an annual rate of $1.63 trillion in the second quarter of 2016.
That most recent quarterly figure is 144 percent higher than in the recession-wracked quarter just before Obama entered office.
Previous to Obama’s tenure, the best year for after-tax corporate profits was 2006, when they hit just under $1.38 trillion. Profits have now exceeded that old record for the past six years running, and are on track to do so again in Obama’s final year in office.
Stock Markets – Stocks have moved even higher since our last report. In fact, all three major stock market indexes set records on a single day, Aug. 15.
As of the market close on Oct. 7, the Standard & Poor’s 500-stock index was 167 percent higher than it was the day Obama took office.
Other stock indexes show similarly robust gains. The Dow Jones Industrial Average also has more than doubled, rising 129 percent during Obama’s tenure, and the NASDAQ Composite index has more than tripled, rising 267 percent.
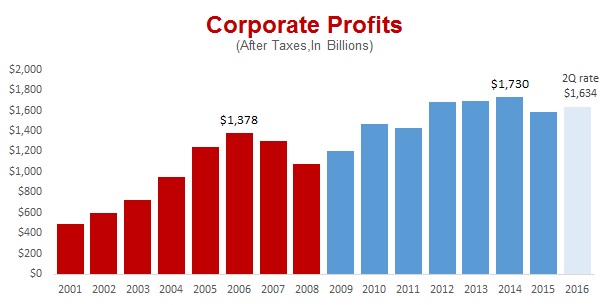
Home Prices
Home values — after years of decline before and during Obama’s first term — have now rebounded. The most recent monthly sales figures from the National Association of Realtors show the national median price of an existing, single-family home was $242,200 in August. That is $45,600 higher than in all of 2008, an increase of 23 percent under Obama.
Furthermore, the most recent figure is higher than before the housing bubble burst in 2007, bringing on a financial crisis and the worst recession since the 1930s. The August figure was $20,300, or 9 percent, higher than the median for all of the peak year of 2006.
The Realtors figures reflect raw sales prices without attempting to adjust for such factors as variations in the size, location, age or condition of the homes sold in a given month or year. Even so, a similar pattern emerges from the S&P CoreLogic Case-Shiller U.S. National Home Price Index, which compares sales prices of similar homes and seeks to measure changes in the total value of all existing single-family housing stock.
The Case-Shiller index for July sales also was 23 percent higher than where it stood in the month Obama took office, but 0.6 percent below the peak level reached in July 2006.
Crime
The number of murders in the U.S. jumped up nearly 11 percent last year, the worst such one-year spike since 1990. No one is sure why; there are competing theories.
Even so, there were fewer murders and less violent crime overall last year than in 2008. In fact, in each of the first seven years of the Obama administration, Americans were less likely to be murdered than in any year since 1968. 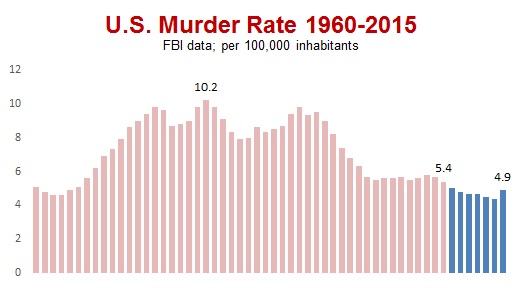 According to the FBI’s most recent annual statistics, there were 15,696 murders in 2015, which is 769 fewer than in 2008.
The murder rate was 4.9 per 100,000 inhabitants, down from 5.4 in 2008. And the overall rate of violent crime dropped nearly 19 percent during the same period.
Furthermore, the murder rate in 2014 was at the lowest level since at least 1960. And even last year’s rate was less than half the peak rate of 10.2 per 100,000 recorded in 1980.
That may not remain true in 2016, however. A further 13 percent increase in the murder rate is projected for 2016 in a preliminary analysis by the Brennan Center for Justice at the New York University School of Law. That’s based on police reports for roughly the first half of the year, collected from the 30 largest U.S. cities. About half the predicted increase is attributed to Chicago, which alone has seen more than 500 murders so far this year.
Unauthorized Immigrants
The number of people living in the U.S. illegally has declined under Obama, according to independent estimates by demographers. And a key indicator of the flow of illegal immigration across the U.S.-Mexico border has plunged dramatically.
Population – The Pew Research Center estimated the number living illegally in the U.S. at 11.7 million in 2008, and most recently (in a report released Sept. 21) at a revised figure of 11.1 million in 2014, a decline of roughly 600,000, or 5 percent.
The Center for Migration Studies earlier estimated that the drop has been even more pronounced, going from 12 million in 2008 to 10.9 million in 2014. That would be a decrease of 1.1 million, or 9 percent. (See Figure 1, page 3.)
Such estimates are inexact; those breaking the law by being here can’t be expected to confess that to Census officials. But demographers have applied consistent methodologies from year to year, and agree that the trend has been downward.
Border Crossings – Even as the number of agents stationed at the border has increased, the number of unauthorized immigrants caught trying to cross the U.S.-Mexico border fell to 331,333 last fiscal year. That’s a reduction of 53 percent compared with the 705,005 unauthorized immigrants apprehended at the southwest border in the fiscal year that ended Sept. 30, 2008, less than four months before Obama first took office.
The number of agents stationed at the U.S.-Mexico border nearly doubled under President Bush, growing from 9,147 agents at the southwest border in fiscal year 2001 to 17,408 in FY 2009, under funding levels established by Bush.
Under Obama, that number continued to increase, hitting a peak of 18,611 in FY 2013. The number declined to 17,522 in the last fiscal year, about 1 percent above the number Obama inherited.
Food Stamps
The number of people receiving food stamps has dropped again — by just over 200,000 — since our last report.
But as of July, the most recent month on record, nearly 43.4 million Americans were still receiving the food aid, now known as the Supplemental Nutrition Assistance Program.
That’s down by 9.3 percent from the record level set in December 2012, but it is still 35.6 percent higher than it was when Obama took office in 2009.
As we noted when Republicans called Obama the “Food Stamp President,” 14.7 million people were added to the food-stamp rolls during George W. Bush’s time in office. By comparison, the net gain under Obama now stands at under 11.4 million — and the rolls continue to shrink.
Debt and Deficits
Debt – The federal debt has more than doubled under Obama.
As of Oct. 4, the U.S. government’s debt owed to the public was well over $14 trillion, an increase of nearly 125 percent since Obama first took office.
The debt also has grown dramatically even when measured as a percentage of the growing economy, from 52 percent of gross domestic product at the end of fiscal year 2009 to an estimated 76.6 percent as of the end of fiscal year 2016 on Sept. 30, according to the most recent estimate, published Aug. 23, by the nonpartisan Congressional Budget Office.
Deficits – Annual federal deficits hit $1.4 trillion in fiscal year 2009. As we’ve documented elsewhere, Obama inherited most of that deficit and signed spending measures that contributed, at most, $203 billion to FY 2009’s red ink.
After that, the yearly deficits declined markedly for several years. In fiscal year 2015, the deficit was $438 billion, a drop of 69 percent from FY 2009.
But deficits are again on the rise. CBO estimated most recently that the deficit for FY 2016 will increase to $588 billion by the time the Treasury Department completes a full accounting later this month. And without further cuts in spending or increases in revenue, Obama will leave his successor with rising debt and deficits.
CBO projects that under current law, annual deficits will again hit $1 trillion in 2024 and beyond. As things stand, federal debt owed to the public will reach over 80 percent of GDP in 2022, and nearly 86 percent in 2026, CBO projects.
Home Ownership
The home ownership rate slipped again since our last report, to the lowest point in over half a century.
In the second quarter of 2016, 62.9 percent of households owned their own home, according to the latest Census Bureau figures. That ties the lowest point since the Census Bureau began collecting the figures. The last time the rate was this low was in the third quarter of 1965.
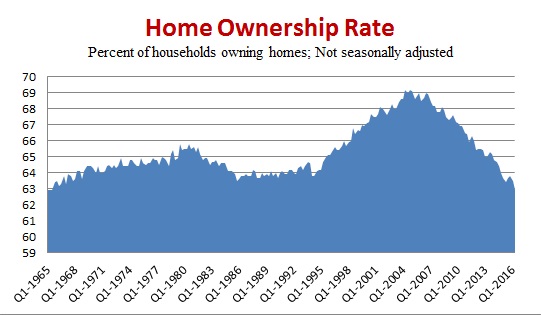 The home ownership rate began to slide even before Obama took office. It peaked at 69.2 percent in the second quarter of 2004.
But most of the decline since then has occurred under Obama. The most recent rate is 4.6 percentage points lower than in the quarter just before Obama first entered the White House.
Energy
U.S. Crude Oil Production – U.S. crude oil production surged under Obama, helping drive down fuel prices.
In the second quarter of 2016, the U.S. produced 77.7 percent more crude oil than it did in the three months before Obama began his presidency.
The oil boom peaked in the first quarter of 2015, at which time production had nearly doubled; it was up 91 percent under Obama. But production has declined since then. That’s because the price of crude oil plunged from more than $100 a barrel in 2014 to below $30 early this year. That led to a huge drop in drilling. There were only 320 crude oil rigs in operation in May, down from an average of 1,527 during all of 2014, a decline of 79 percent.
And even though the price of crude oil has recovered more recently to around $50 a barrel, the Energy Information Administration predicted in its September Short-Term Energy Outlook that oil production will decline further this year and stabilize in 2017.
Oil Imports & Dependency — Under Obama, U.S. reliance on imported oil has been cut by more than half. As of the second quarter of 2016, net imports were down 58 percent.
In 2015, the U.S. imported only 24 percent of the petroleum and refined products that it consumed, which was the lowest annual level of dependency on imports since 1970.
However, with recent declines in U.S. production, dependency on imports has begun creeping upward once again. For the first eight months of 2016, imports have accounted for an average of 27.5 percent of consumption.
Wind & Solar – Wind and solar power has more than quadrupled under Obama. Electricity generated by large-scale wind and solar power in the most recent 12 months on record (ending in July) was 342 percent higher than the total for 2008.
The increase in solar power in particular has been spectacular. The U.S. generated nearly 37 times more electricity from solar power in the most recent 12 months than it did in the year before Obama took office. However, wind and solar still accounted for only 5.9 percent of total large-scale generation in the most recent 12 months (ending in July), up from 1.4 percent in 2008.
These figures are for “utility scale” electricity generation. In 2014, EIA also began tracking small-scale (under 1 megawatt) “distributed” solar voltaic generation, such as the power produced by rooftop systems installed by homeowners. In the most recent 12 months, wind and solar accounted for 6.5 percent of the combined total of utility-scale power and “distributed” solar power.
Coal – U.S. coal production has dropped sharply under Obama, who has imposed new restrictions that his administration calls a “Clean Power Plan” and his critics have called his “War On Coal.”
In the 12 months ending in August, U.S. coal production was well over 400 million metric tons less than it was in 2008, according to data from the U.S. Energy Information Administration. That’s a decline of 36 percent.
During the Obama years, electric utilities shifted away from burning coal, which accounted for 48 percent of their power generation in 2008, but only 30 percent in the most recent 12 months. The share supplied by burning natural gas has gone up from 21 percent to 34 percent, and the share supplied by nuclear plants has remained steady at just under 20 percent.
Carbon Emissions – Meanwhile, the amount of carbon dioxide emitted into the atmosphere from U.S. energy-related sources has declined during Obama’s time.
Between 2008 and the most recent 12 months on record (ending in June) the amount of carbon dioxide emissions has gone down 12 percent, according to estimates from the EIA.
EIA analysts say the largest factors affecting emissions are the economy and the weather. But lately emissions have been falling even as the economy has been growing. One reason is that utilities have been switching over to gas and away from coal, driven both by government regulation and the relatively lower cost of burning gas. Emissions from electric power plants in 2015 were the lowest since 1993, EIA reports.
Unfulfilled Promises
In previous updates, we’ve kept track of some notable failures by Obama to deliver on promises regarding gun control, international trade and confinement of suspected terrorists. We update those here briefly.
Guns — Not only has Obama failed to persuade Congress to reinstate the “assault weapon” ban that expired in 2004, as he proposed during his 2008 campaign, his tenure has been marked by a remarkable increase in the production and sale of handguns.
Government figures released at the end of August show annual U.S. production of pistols and revolvers totaled nearly 4.3 million last year. That’s an increase of 134 percent over the figure for 2008. And the figures from the Bureau of Alcohol, Tobacco, Firearms and Explosives show that 96 percent of those handguns produced in 2015 were not exported, but presumably sold in the United States.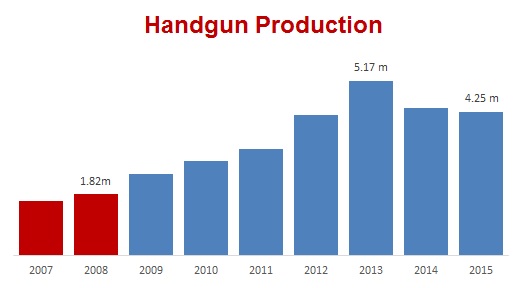 The peak of production came in 2013, which the National Shooting Sports Foundation — the gun industry’s trade group — described quite accurately as “a year unlike any other in the industry’s history.” That year handgun production was nearly triple (up 184 percent) what it had been in 2008.
Gun sales have followed a similar pattern. Though the government does not collect statistics on sales, the NSSF tracks approximate sales figures by adjusting FBI statistics on background checks to remove those not related to actual sales, such as checks required for concealed-carry permits.
These adjusted figures are only approximations of actual sales, since some of these checks cover purchases of multiple weapons, and of course some sales still occur without background checks.
These adjusted figures also cover rifles and shotguns and previously owned weapons, as well as new handguns.
And as we reported in our January update, this approximate gun-sales figure was 14.2 million last year, a 58 percent increase over 2008. That figure also peaked in 2013, at 14.8 million, or 65 percent higher than 2008.
Trade — As we’ve reported regularly in previous updates, Obama failed spectacularly to deliver on his 2010 promise to “double our exports over the next five years.”
In fact, the most recent quarterly report from the U.S. Bureau of Economic Analysis shows U.S. exports of goods and services have gone up by only 28 percent since the quarter before Obama took office.
Lately, exports actually have been shrinking as the economies of China and other U.S. trading partners struggle. Second-quarter exports were down 1.3 percent from the previous quarter, and were 4.6 percent below the same period a year earlier.
However, imports have risen even less, and thus the U.S. trade deficit has shrunk. The most recent annual figures show the U.S. trade deficit in goods and services shrunk 29 percent between 2008, the year before Obama took office, and 2015, the most recent full year on record.
And the trend has continued in 2016. Through the end of August, that trade deficit has decreased $4.3 billion, or 1.3 percent, from the same period in 2015, according to the most recent monthly release by the Bureau of Economic Analysis.
Car Mileage — The fuel efficiency of new vehicles remains far short of Obama’s goal.
The average EPA city/highway sticker mileage of light duty vehicles sold in September was 25.2 miles per gallon, according to the Transportation Research Institute of the University of Michigan, exactly where it was a year earlier, and only 20 percent above where it was the month in which Obama took office.
These figures leave the president far short of his goal of a 100 percent improvement. He boasted in 2013 that “we have doubled the distance our cars will go on a gallon of gas.” What he meant was that the administration was putting in place government requirements that cars and light trucks average 54.5 mpg by model year 2025.
But for the past three model years in a row, the 12-month averages for new vehicles sold has remained stuck at 25.3 mpg.
One reason actual mileage in the real world isn’t improving: Low gasoline prices have prompted consumers to buy more pickup trucks and big sport-utility vehicles, and not so many smaller, thrifty cars. So monthly new-vehicle mileage has actually declined 0.6 mpg since peaking in August 2014.
Guantanamo
Since our last report, 18 more prisoners have been released from the military detention camp for suspected terrorists in Guantanamo Bay, Cuba. They include 15 who were accepted in August by the United Arab Emirates, the largest single transfer of the Obama administration.
But as of Oct. 6, 61 still remained at the facility that Obama ordered to be closed within a year of his first taking office. In the more than seven years since then, the population has been reduced by 75 percent.
More are expected to be released in the closing months of the Obama presidency. The president said in a Dec. 18, 2015, news conference that “we will continue to steadily chip away at the numbers in Guantanamo.” And in February, he gave Congress his plan to transfer the remaining prisoners and finally to close the facility in Cuba.
War Deaths
Since our last report, four more U.S. military personnel have died supporting the anti-Islamic State efforts in Iraq and elsewhere, all of non-combat injuries. They included an Air National Guard lieutenant colonel serving in southwest Asia, an Air Force first lieutenant found dead in her room in Abu Dhabi, an Army first lieutenant who died in Kuwait and an Army warrant officer who died in the United Arab Emirates.
Those deaths bring the Iraq total to 284 since Obama became commander in chief, according to the tally kept by iCasualties.org.
Meanwhile, three more have died in the Afghan conflict. They include an Army staff sergeant killed by an improvised explosive device in Helmand Province, another who died of a non-combat injury in Kandahar and an Army special forces sergeant killed by an IED in Nangarhar Province, where he was patrolling against Islamic-State forces there.
Those deaths brought the total killed in the Afghan conflict to 1,755 since Obama took office.
Note to Readers
This is the last “Obama’s Numbers” update that will appear before voters choose his successor on Nov. 8. We will post another update in January, covering three more months of data, just before he leaves office.
After that, we plan to post a “final” update later in 2017, giving a statistical portrait of his eight years in office that is as current and complete as possible. And we’ll keep that “final” article revised and updated as necessary to reflect new or revised statistics as they trickle in over time.
Sources
Bureau of Labor Statistics. “Employment, Hours, and Earnings from the Current Employment Statistics survey (National); Total Nonfarm Employment, Seasonally Adjusted.” Data extracted 7 Oct 2016.
Bureau of Labor Statistics. “Labor Force Statistics from the Current Population Survey; Unemployment Rate, Seasonally Adjusted.” Data extracted 7 Oct 2016.
Bureau of Labor Statistics. “Job Openings and Labor Turnover Survey: Job Openings, Seasonally Adjusted.” Data extracted 7 Oct
Bureau of Labor Statistics. “Labor Force Statistics from the Current Population Survey; Labor Force Participation Rate.” Data extracted 7 Oct 2016.
Bureau of Labor Statistics. “Labor Force Statistics from the Current Population Survey; Number Unemployed for 27 Weeks & Over, Seasonally Adjusted.” Data extracted 7 Oct 2016.
Bureau of Labor Statistics. “Labor Force Statistics from the Current Population Survey; Average Weeks Unemployed, Seasonally Adjusted.” Data extracted 7 Oct 2016.
U.S. Census Bureau. “Income, Poverty and Health Insurance Coverage in the United States: 2015.” 13 Sep 2016.
Bureau of Labor Statistics. “Employment, Hours, and Earnings from the Current Employment Statistics survey (National); Average Weekly Earnings of All Employees, 1982-1984 Dollars.” Data extracted 7 Oct 2016.
Bureau of Labor Statistics. “Consumer Price Index – All Urban Consumers.” Data extracted 7 Oct 2016.
Smith, Jessica C. and Carla Medalia. “Health Insurance Coverage in the United States; 2014.” 13 Sep 2016.
Centers for Disease Control and Prevention; National Health Interview Survey. “Early Release of Selected Estimates Based on Data From the National Health Interview Survey, January – March 2016.” Sep 2016.
U.S. Bureau of Economic Analysis. “Table 6.19D. Corporate Profits After Tax by Industry.” 3 Aug 2016; Data extracted 7 Oct 2016.
Federal Reserve Bank of St Louis. “Corporate Profits After Tax (without IVA and CCAdj) (CP).” Data extracted 7 Oct 2016.
Google Finance. “S&P 500.” Historical prices. Data extracted 7 Oct 2016.
Google Finance. “Dow Jones Industrial Average.” Historical prices. Data extracted 7 Oct 2016.
Google Finance. “NASDAQ Composite.” Historical prices. Data extracted 7 Oct 2016.
National Association of Realtors. “Sales Price of Existing Single-Family Homes.” 22 Sep 2016.
S&P CoreLogic Case-Shiller U.S. National Home Price NSA Index. 27 Sep 2016: Data extracted 7 Oct 2016.
Federal Bureau of Investigation. “Crime in the United States 2015.” Table 1. 26 Sep 2016.
Friedman, Matthew and Ames C. Grawert and James Cullen. “Crime in 2016: A Preliminary Analysis.” Brennan Center for Justice. 19 Sep 2016.
Madhani, Aamer. “Chicago hits 500 homicides for 2016 after deadly Labor Day weekend.” USA Today. 6 Sep 2016.
Federal Bureau of Investigation. “NICS Firearm Background Checks Month/Year by State/Type.” Data extracted 7 Oct 2016.
Passel, Jeffrey et al. “Table A1: Unauthorized Immigrant Population.” Pew Research Center. 3 Sep 2014.
Passel, Jeffrey and D’Vera Cohn. “Unauthorized immigrant population stable for half a decade.” Pew Research Center. 21 Sep 2016.
Warren, Robert. “US Undocumented Population Drops Below 11 Million in 2014, with Continued Declines in the Mexican Undocumented Population.” Journal on Migration and Human Security. Center for Migration Studies. 20 Jan 2016.
U.S. Border Patrol. “Border Patrol Agent Staffing by Fiscal Year.” 19 Sep 2015.
U.S. Border Patrol. “Southwest Border Sectors: Total Illegal Alien Apprehensions By Fiscal Year (Oct. 1st through Sept. 30th).” Undated. Accessed 7 Oct 2016.
U.S. Department of Agriculture, Food and Nutrition Service. “Supplemental Nutrition Assistance Program (Data as of Sept. 9 2016).” Data extracted 7 Oct. 2016.
U.S. Treasury. “The Debt to the Penny and Who Holds It.” 5 Oct 2016. Data extracted 7 Oct 2016.
Office of Management and Budget. “Table 1.1—Summary of Receipts, Outlays, and Surpluses or Deficits (-): 1789–2021.” Mar 2016.
Congressional Budget Office. “CBO’s August 2016 Report: Updated Budget Projections: 2016 to 2026.” 23 Aug 2016.
Congressional Budget Office. “Monthly Budget Review for September 2016.” 7 Oct 2016.
U.S. Census Bureau. “Time Series: Not Seasonally Adjusted Home Ownership Rate.” Data extracted 7 Oct 2016.
U.S. Energy Information Administration. “U.S. Crude Oil Production.” Short Term Energy Outlook. 7 Sep 2016. Data extracted 7 Oct 2016.
U.S. Energy Information Administration. “Table 3.3a Petroleum Trade: Overview.” Monthly Energy Review. 27 Sep 2016.
U.S. Energy Information Administration. Electric Power Monthly, “Table 1.1.A. Net Generation from Renewable Sources: Total (All Sectors), 2006-January 2016.” 26 Sep 2016.
U.S. Energy Information Administration. “Coal Production; Total U.S.” Short Term Energy Outlook. 7 Sep 2016. Data extracted 7 Oct 2016.
U.S. Energy Information Administration. “Table 12.1 Carbon Dioxide Emissions From Energy Consumption by Source,” Monthly Energy Review. 27 Sep 2016.
U.S. Bureau of Alcohol, Tobacco, Firearms and Explosives. “Annual Firearms Manufacturing and Export Report,” Year 2015 Interim.” 18 Aug 2016.
U.S. Bureau of Alcohol, Tobacco, Firearms and Explosives. “Annual Firearms Manufacturing and Export Report,” Year 2008.” 8 Mar 2011.
U.S. Census Bureau. “U.S. Trade in Goods and Services – Balance of Payments (BOP) Basis.” 4 Mar 2016.
U.S. Department of Commerce, Bureau of Economic Affairs. “Table 1. U.S. International Transactions: Exports of Goods and Services.” 15 Sep 2016.
U.S. Department of Commerce, Bureau of Economic Affairs. “Table 1. U.S. International Transactions: Imports of Goods and Services.” 15 Sep 2016.
U.S. Census Bureau. “U.S. International Trade In Goods And Services, August 2016.” News Release. 5 Oct 2016.
Sivak, Michael and Brandon Schoettle. “Average sales-weighted fuel-economy rating (window sticker) of purchased new vehicles for October 2007 through March 2016.” University of Michigan Transportation Research Institute. 4 Oct 2016.
iCasualties.org. “Operation Enduring Freedom/Afghanistan; Afghanistan Coalition Military Fatalities by Year.” Data extracted 7 Oct 2016.
iCasualties.org. “Operation Iraqi Freedom; Iraq Coalition Military Fatalities by Year.” Data extracted 7 Oct 2016.