




Summary
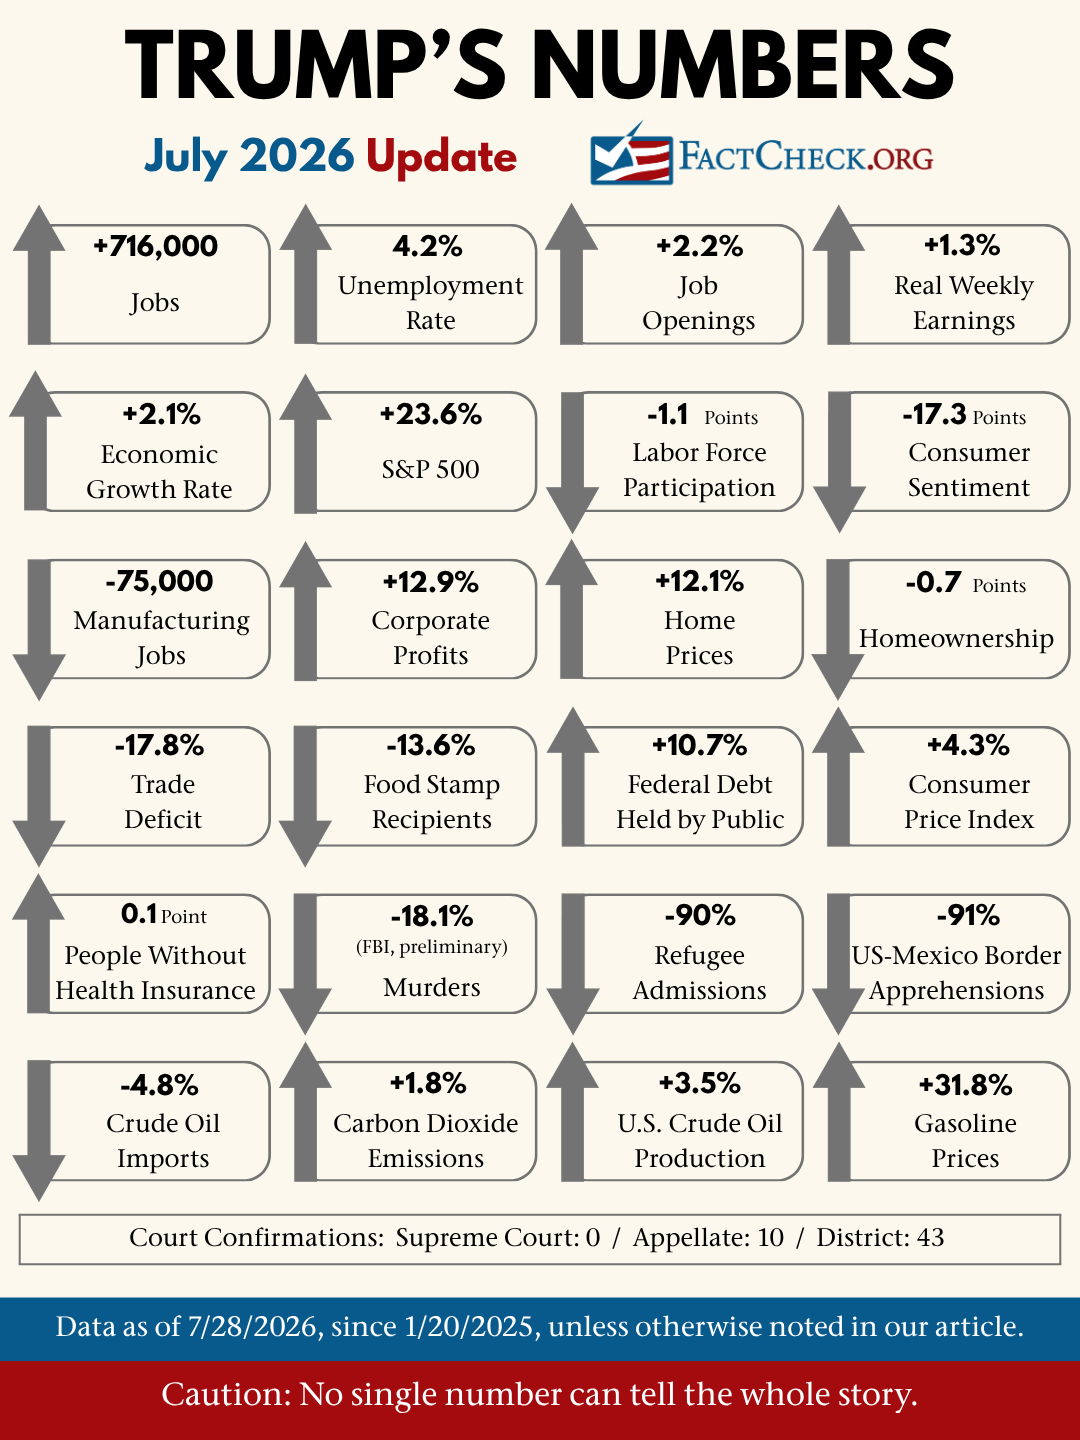
Our latest update in this series provides economic and other metrics of President Donald Trump’s second term, so far.
- Job growth remains slower, with a total of 716,000 jobs created as of June. The unemployment rate remains slightly higher at 4.2%.
- Inflation worsened to 3.5% in June, and gasoline prices have risen to more than $4 per gallon after a ceasefire with Iran dissolved.
- Average weekly earnings of private-sector workers, adjusted for inflation, rose 1.3%.
- The economy grew 2.1% in the first quarter of 2026, matching the 2025 full-year growth.
- Consumer sentiment hit a new record low in May but has improved slightly since.
- Home prices have continued to creep up. The median sales price in June was 3.1% higher than two years ago.
- The number of apprehensions at the U.S. border with Mexico decreased about 91%, and refugee admissions have plummeted.
- There wasn’t much change in the percentage of the population lacking health insurance, as of 2025.
- The trade deficit for the most recent 12 months was down 17.8% compared with 2024.
- The number of murders and non-negligent manslaughters declined by 18.1%, according to preliminary FBI figures.
- The S&P 500 went up 23.6%.
- About 5.8 million fewer people are receiving federal food assistance.
- The public debt is up about 10.7%.
Analysis
This is the second quarterly update in our “Numbers” series for Trump’s second term. Expect additional updates to be published every three months for the remainder of his presidency, as we did for his predecessors, starting with President Barack Obama in 2012.
These are just some of the many economic and social statistics that indicate how the U.S. is faring.
We present the numbers without commentary. Depending on the reader’s perspective, some may seem positive, negative or neither. We also make no judgement on how much credit or blame the president should receive.
Jobs and Unemployment
Job growth slowed markedly, and unemployment crept up during Trump’s second term. Manufacturing jobs continued to decline despite new tariffs on imports. But job opportunities have increased a bit.
Employment — Employment growth became sluggish during Trump’s first 17 months in office.
The most recent figures from the U.S. Bureau of Labor Statistics show an increase of only 716,000 in total nonfarm employment between January 2025 and June 2026.
The total went up nearly three times faster before, rising by 2,007,000 during the final 17 months of President Joe Biden’s administration, even after the BLS revised Biden’s figures downward in February as a result of its annual “benchmarking” study.
Much of the sluggishness under Trump is due to the president’s deliberate slashing of the federal workforce. Federal government employment has fallen by 324,000, or 10.8%, since he took office.
Looking only at the private sector — excluding federal, state and local government workers — 902,000 jobs were added during Trump’s term so far. But that’s still far less than the 1,357,000 added in the preceding 17 months.
Last August, after the BLS reported only 73,000 jobs had been gained in July 2025, Trump called the figures “rigged” and “phony” and fired BLS Commissioner Erika McEntarfer. But the numbers have been even worse since then. The gain for July 2025 has been revised downward to 64,000, and the BLS reports that the economy actually lost jobs in August, October, December and February.
Manufacturing Jobs — Last year, Trump predicted a flood of new factory jobs as he announced sweeping new tariffs on what he called “Liberation Day,” April 2, 2025.
“Jobs and factories will come roaring back into our country,” he said. But so far that hasn’t happened. The economy has continued to lose manufacturing jobs.
During Trump’s first 17 months, the loss was 75,000, following a loss of 188,000 in the preceding 17 months.
Labor Force Participation — The labor force participation rate declined in Trump’s second term, dropping from 62.6% in January 2025 to 61.5% as of June.
That’s the lowest rate in half a century, except for the months when the COVID-19 pandemic disrupted the economy. And it is well below the rate when candidate Trump attacked the Biden administration in a speech to the Conservative Political Action Conference. “The labor force participation is the worst in many, many decades,” he said then. “That’s the number that you have to look at.” That was August 2022, when the rate was 62.3%.
The rate is the portion of the population over age 16 that is working or seeking work. It generally has been in a long decline as the population ages and people retire.
Unemployment — The unemployment rate has gone up slightly since Trump took office. It was 4.0% in January 2025 and most recently was 4.2% in June.
But that is still well below the historical norm. The median rate for all months since 1948 is 5.5%.
Job Openings — The number of job openings edged up by 163,000, or 2.2% under Trump, as of the last day of May.
Meanwhile, the number of people officially listed as unemployed and seeking work rose by 229,000, or 3.3%, as of June.
So there are now 7.1 million unemployed job-seekers and 7.6 million job openings.
Wages and Inflation
Inflation has worsened during Trump’s tenure, but wages have increased faster than prices.
CPI — Trump campaigned on a promise to reduce inflation, but so far he hasn’t succeeded.
In the 12 months before Trump took office, the Consumer Price Index, the most commonly cited measure of inflation, rose 3.0%. And in the most recent BLS report, the 12-month increase was 3.5%.
Over Trump’s first 17 months in office, the CPI went up 4.3%, pushed up most recently by the U.S.-Israeli strikes on Iran, which have sent up gasoline prices in particular.
Fuel prices — always volatile — had been a bright spot for Trump before. As of our “Trump’s Numbers” report in January, before the Iran strikes, the national average price for regular gasoline at the pump had declined to $2.78 a gallon, down from $3.11 the week he was sworn in for his second term.
But then the average spiked as high as $4.50, during the week ending May 11, according to the Energy Information Administration.
The average has since eased to $4.10 as of the week ending July 27, but that’s still about 31.8% higher than it was when Trump took office.
Overall inflation is twice as high as the Federal Reserve would like, and it’s going in the wrong direction as measured by the Fed’s preferred metric, the Personal Consumption Expenditures Index, compiled by the Bureau of Economic Analysis.
The central bank’s target is a 2% annual increase in the PCE. When Trump took office, the 12-month increase in the PCE was 2.5%. But the most recent report put the 12-month increase at 4.1% in May. (PCE figures take longer to collect than the CPI, but the Fed prefers the measure because it is more comprehensive and adjusts more quickly to consumers’ buying habits.)
Wages — Wage increases accelerated under Trump, even adjusted for worsening inflation.
The average weekly earnings of all private-sector workers, adjusted for inflation, rose 1.3% during Trump’s first 17 months. They were rising when he took office, but had only gone up 0.6% in the preceding 17 months.
Those figures include professionals, executives and supervisory employees, whose pay is normally higher. But rank-and-file wage earners are seeing similar gains. For private-sector production and nonsupervisory employees, real average earnings also rose 1.3% under Trump through June, after a 1.2% rise in the preceding 17-month period.
Economic Growth
The U.S. economy overall has remained solid despite absorbing jarring economic shocks, including stubborn inflation and the on-again, off-again U.S. war with Iran.
The nation’s real gross domestic product grew at an annualized rate of 2.1% in the first quarter of 2026 – matching the full-year growth for 2025, the Bureau of Economic Analysis reported last month.
But growth remains uneven and subject to risk because of the war.
“Overall, the US economy remains resilient, but the foundation of growth has become narrower,” EY-Parthenon Chief Economist Gregory Daco said in a June 25 analysis of the BEA’s first quarter final estimate. “Interest rate-sensitive sectors continue to struggle under elevated financing costs, while an income squeeze driven by slower wage growth and higher inflation is constraining consumer spending. Business investment has strengthened, supported by AI-related capital spending, but housing activity remains in the doldrums.”
For the year, Daco projects “a slow-growth, sticky-inflation environment, with real GDP growth of around 1.9%.” That estimate is similar to other economic projections.
Early this month, the International Monetary Fund projected growth of 2.3% for the United States in 2026 in its updated World Economic Outlook.
“The outlook is uneven: The war shock is weighing on energy importers and vulnerable economies, while AI-driven demand is lifting countries integrated into the global technology value chain,” the IMF said.
In its five-year economic forecast, the Deloitte Global Economics Research Center noted that while economic conditions “remain highly fluid,” the U.S. economy is expected to grow by “a healthy 2.0%” in 2026.
As of July 27, the Federal Reserve Bank of Atlanta’s GDPNow model was projecting growth of 1.6% for the second quarter. The BEA second quarter estimate will be released July 30.
Consumer Sentiment
Since our last report, consumer sentiment – as measured by the University of Michigan’s Surveys of Consumers – reached a record low in May.
The university’s final Index of Consumer Sentiment for May was 44.8 – “just below the previous historical trough seen in June 2022,” Joanne W. Hsu, director of the Surveys of Consumers, said in a May 22 press release.
Things have slightly improved since then.
The university’s preliminary Index of Consumer Sentiment for July was 54.4 – marking the second straight month of rising consumer confidence in the U.S. economy.
“However, with prices remaining frustratingly high, consumers are hardly ebullient about the economy; sentiment is down 12% from a year ago,” Hsu said in a release earlier this month on the preliminary July report.
Consumer sentiment is also far below its lowest point during Trump’s first term – 71.8 in April 2020, during the early stages of the COVID-19 pandemic. And it’s 17.3 points lower than it was in January 2025, when Trump took office for a second time.
Hsu also noted that the preliminary July report largely doesn’t reflect consumer sentiment about the resumption of the U.S.-Iran war. “Interviews for this release spanned June 23 to July 13, with more than 70% completed before the resumption of US strikes against Iran on July 7 and the subsequent increase in gas prices,” Hsu said.
The university will release the final July data on July 31.
In its most recent Consumer Confidence Survey, the Conference Board — a research organization with more than 2,000 member companies — reported a slight downturn. “Consumer confidence moderated slightly in July, continuing a general downward sloping trajectory since late 2021,” said Dana M. Peterson, the board’s chief economist.
Home Prices & Homeownership
Homeownership — Homeowner rates continue to remain largely unchanged under Trump.
The most recent homeownership rate, which the Census Bureau measures as the percentage of “occupied housing units that are owner-occupied,” was 65% in the second quarter of 2026 – 0.7 percentage points lower than it was in Biden’s last quarter in office.
But the bureau says the second quarter rate is “virtually the same” as it was in the second quarter of 2025 and “not statistically different” than the previous quarter, so little has changed under Trump.
There are significant differences in homeownership rates among U.S. regions, although that was true under Biden, too.
“Regional differences remain pronounced,” Realtor.com Senior Economic Research Analyst Hannah Jones said after the Census Bureau released the first quarter estimate. “The Midwest continues to stand out for its high homeownership rate, reaching 70.1% in Q1 2026, well above the South (66.9%), Northeast (61.5%), and West (60.7%), and posting the only statistically significant year-over-year gain in homeownership of any region.”
The article on Realtor.com attributed the higher rate of ownership in the Midwest to “relative affordability compared to coastal regions.”
The regional differences, however, also remained largely unchanged in the first quarter of 2026. The rates are slightly lower in all four U.S. regions compared with Biden’s last quarter in office – including the Midwest.
In the fourth quarter of 2024, the Northeast had a homeownership rate of 61.9%, the Midwest 71.1%, the South 67% and West 61.1%.
Home prices — Home prices have continued to creep higher under Trump.
The preliminary national median price of an existing, single-family home sold in June was $446,400, according to the National Association of Realtors. That’s 12.1% higher than it was in January 2025, when Biden left office and the median price was $398,100.
But the 12.1% increase doesn’t account for seasonal fluctuations. The increase is far more modest when comparing the June figure with June 2024.
The median sales price of an existing, single-family home in June was only 1.8% higher than a year ago and only 3.1% higher than the $432,900 median price in June 2024, when Biden was still in office.
Mortgage prices have also come down under Trump.
The 30-year fixed-rate mortgage averaged 6.55% for the week of July 16, according to Freddie Mac. That’s down from 7.04% in the week of Jan. 16, 2025 — just before Trump returned to the White House for a second term – and down from 6.77% for the week of July 18, 2024, under Biden. (See “download rates since 1971” on the Freddie Mac website.)
Existing home sales and prices for July are scheduled for release Aug. 11.
Immigration
In remarks on July 21, Trump boasted that with regard to the border, in his last 14 months in office, “we had nobody coming through, zero, zero people.” While under Biden, “millions came through,” Trump said, “we had zero people come in illegally into our country.”
That’s not accurate. What he means to say — and as U.S. Customs and Border Protection announced on July 16 — is that there have been no releases at the border over the last 14 months, meaning no one caught crossing the border illegally was temporarily released into the U.S., for example, to apply for asylum. On his first day in office, Trump enacted a policy effectively barring asylum applications.
While it’s impossible to know how many people successfully cross illegally into the U.S., for the purposes of our Numbers stories, going back to Obama, we have calculated the change in border apprehensions as a proxy to measure illegal border crossings. By that measure, illegal border crossings are down significantly under Trump. But the number of such crossings is not zero.
In June, CBP reported, border agents apprehended 9,848 people attempting to illegally cross the southwest border.
Over the last 12 months under Trump, there were 90,875 immigrants apprehended attempting to illegally cross the southern border. That’s down about 91% from the last 12 months under Biden.
The Trump administration has also stepped up interior enforcement and deportations. According to publicly available Immigration and Customs Enforcement data, the average daily population of those detained by ICE during the last three months ending in July is up 272% compared with the last three months under Biden.
The Trump administration is also arresting a greater percentage of people who have neither criminal convictions nor pending criminal charges. In the last three months of the Biden administration, 65% of those detained by ICE had criminal convictions and 29% had pending criminal charges. Just 6% had neither. By contrast, over the last three months, 32.6% of those detained by ICE had criminal convictions and 33.4% had pending charges. The percentage of those detained by ICE with neither criminal convictions nor pending charges was 34%.
On June 10, Trump signed into law the Secure America Act, which provides nearly $70 billion for immigration and border enforcement over three years, more than tripling ICE’s annual budget.
Refugees
After a year and a half in office, Trump continues to restrict refugee admissions largely to South Africa’s white minority Afrikaners.
On Day One, Trump signed an executive order that called for an indefinite suspension of all refugee admissions. Less than two weeks later, Trump issued an order on Feb. 7, 2025, making an exception for Afrikaners – who, he wrongly claimed, have been victims of “a genocide” in their homeland.
The Trump administration continues to follow both executive orders.
The U.S. admitted only 8,236 refugees in Trump’s first full 17 months in office, beginning Feb. 1, 2025, and ending June 30, 2026, according to the State Department’s monthly refugee admissions reports. Refugees from South Africa account for 8,069 refugees, or 98% of the total.
By contrast, the Biden administration admitted 142,229 refugees in its last full 17 months in power, from Aug. 1, 2023, through Dec. 31, 2024, State Department data show.
Overall, the Biden administration admitted 222,832 refugees in Biden’s full 47 months in office, or an average 4,741 refugees per month, the State Department’s data show. So far, Trump has admitted an average of 484.5 refugees per month, or 90% fewer than Biden.
Trump capped refugee admissions at just 7,500 for fiscal year 2026, which ends Sept. 30. In the first nine months of the fiscal year, the Trump administration has actually exceeded the cap, admitting 7,730 refugees. All but three are from South Africa.
Health Insurance
There was a small increase in the number and percentage of those lacking health insurance from 2024 to 2025, though the figures were “not significantly different,” according to early release estimates from the National Health Interview Survey.
In 2025, 8.3% of the U.S. population was uninsured, up just 0.1 percentage point from 2024. In raw numbers, 28 million people lacked insurance, an increase of 800,000 people from 2024. The NHIS measures the uninsured at the time people are interviewed.
The NHIS is a project of the National Center for Health Statistics at the Centers for Disease Control and Prevention.
The Census Bureau’s annual reports measure those who were uninsured for the entire calendar year, but the report for 2025 isn’t expected to be released until the fall.
The 2025 One Big Beautiful Bill Act is expected to increase the number of people who lack health insurance by 10 million over 10 years, according to the nonpartisan Congressional Budget Office’s estimate. But the CBO’s figures show no increase due to the law in 2025; next year, the increase in the uninsured is estimated at 1.3 million people.
Trade Deficit
The U.S. trade deficit in goods and services in 2026 is still on pace for a decrease from 2025.
During the most recent 12 months ending in May, the U.S. imported about $728 billion more in goods and services than it exported, according to the latest data from the Bureau of Economic Analysis. That trade imbalance was down 17.8% from the annual trade deficit of about $885.5 billion in 2024, the revised figures show.
The trade deficit rose to more than $931.9 billion in 2025, partly because of historically large monthly deficits in January, February and March of that year. Those three monthly deficits – each exceeding $100 billion – were due to importers in the U.S. buying more goods to avoid tariffs on imported products that Trump planned to implement.
The international trade gap increased last year despite Trump claiming that his tariffs would reduce the deficit, which had increased by 34.1% under Biden.
Crime
Violent crime has continued to decline since Trump reentered the White House.
The FBI’s final annual nationwide report for 2025 will be released later this year, but the agency announced early estimates in May. It found a 9.3% decrease in violent crime from 2024 to 2025 and an 18.1% drop in murder and non-negligent manslaughter, based on data from thousands of law enforcement agencies covering 96% of the U.S. population.
That matches what several other groups have reported in crime data released more frequently and covering a smaller sample of police agencies.
From 2024 to 2025, AH Datalytics, an independent criminal justice data analysis group, found an 11% drop in the number of violent crimes, based on data from 445 law enforcement agencies across the country covering nearly a third of the U.S. population. Murders declined 17.9%. Both metrics have gone down again in the first five months of 2026, compared with the same time period last year: violent crime dropped 5.6% and murders declined 18.1%, based on data from 586 law enforcement agencies.
Data on the longer-term trend show the number of murders increased in 2020, was essentially flat in 2021 and has been declining since 2022.
Jeff Asher, a co-founder of AH Datalytics, estimated in late May that the FBI would report a 2025 murder rate for the U.S. of 4.1 per 100,000 population, and he said the rate for 2026 likely would be lower than that, setting a new record. (He cautioned that the 2024 to 2026 rates are “still inexact at this point.”) The prior lowest murder rate was 4.4 per 100,000 population in 2014.
Asher provided graphs showing how the murder rate peaked at 10.2 in 1980 and dropped considerably in the 1990s, as estimated by data provided by local law enforcement to the FBI and dating back to 1960.
The Major Cities Chiefs Association, an organization representing police executives in large cities, similarly found a 19.3% decrease in the number of homicides from 2024 to 2025, and for the first quarter of 2026, compared with the same time in 2025, the group found a 17.7% drop. These figures are based on data from 67 city agencies.
The Council on Criminal Justice, a nonprofit think tank, found similar percentage decreases among 35 U.S. cities from 2024 to 2025: a 21% drop in the rate of homicides, which represents 922 fewer homicides. Its midyear report for 2026 said there was “no single or easy explanation” for the likely historic lows in the homicide rate, and it discussed the recent trend since 2019, just before the COVID-19 pandemic.
“Following the historic 30% increase in homicide from 2019 to 2020, CCJ’s last report estimated that the 2025 national homicide rate will likely be at its lowest level since at least 1900. Trends through the first half of 2026 show that the decline, which began in the second half of 2022, has continued, advancing well beyond the ‘return to normal’ phase seen after the spike in 2020,” CCJ’s midyear update on crime trends said. “There is no single or easy explanation for these historic lows. Researchers and practitioners have pointed to a range of possible influences, including changes in criminal justice operations and strategies, technological advances, and broad shifts in society and culture.”
CCJ found there were lower reported rates for nine of the 13 offenses it examined when comparing the first half of 2026 with the same period last year.
Corporate Profits
Corporate profits reached a new high in the first three months of 2026.
After-tax corporate profits were $3.95 trillion at an annualized rate in the first quarter of this year – up $158.5 billion, or 4.2%, from the previous quarter, according to the Bureau of Economic Analysis. The first quarter figure is 12.9% higher than in 2024, the year before Trump took office.
As we wrote in the last edition of Trump’s Numbers, after-tax corporate profits were nearly $3.52 trillion for the full year in 2025 – extending the streak of earnings growth to 10 consecutive years.
The BEA estimate for second quarter 2026 profits for this year will be released Aug. 26.
Stock Market
The stock market is up since our last update, but it has continued to experience some turbulence amid the ongoing war with Iran – as peace talks between the U.S. and Iran continue to start and stop, causing the market to react each time the fighting ceases or resumes.
As of July 27, the S&P 500, which is made up of 500 large-cap companies, closed at 23.6% higher than it was three days prior to Trump’s second inauguration.
Over that same period, the Dow Jones Industrial Average, made up of 30 large corporations, climbed almost 20.1%.
At the same time, the Nasdaq composite index, comprising more than 3,000 companies, many in the technology sector, jumped about 27.2% between Jan. 17, 2025, and July 27.
The stock market gains have continued since the substantial increases during the Biden administration, when the S&P rose 57.8%, the Dow Jones went up 40.6%, and the Nasdaq increased by 48.7%.
Oil Production and Imports
During Trump’s most recent 12 months in office (ending in April), crude oil production in the U.S. averaged nearly 13.7 million barrels per day, according to the latest Energy Information Administration data. That was about 3.5% higher than the more than 13.2 million barrels produced daily in 2024.
Production in Biden’s last year had been a record until it was eclipsed under Trump in 2025, when almost 13.6 million barrels were produced each day. The EIA attributed the increase in crude oil production to “efficiency improvements” in 2024 that continued into 2025.
The EIA currently projects that daily production will average a new high in 2026 – 13.8 million barrels a day – according to its Short-Term Energy Outlook published in July. The last time we wrote about production in April, the EIA was expecting daily output to dip a bit in 2026.
At the same time, crude oil imports have increased slightly since our last update — rising to almost 6.3 million barrels imported on average each day in Trump’s most recent 12 months as president. But imports are still down about 4.8% from about 6.6 million imported barrels daily in 2024.
Carbon Emissions
Since he returned to office, U.S. carbon dioxide emissions from energy consumption have increased marginally under Trump.
In his most recent 12 months (ending in March), there were almost 4.9 billion metric tons of emissions from the use of coal, natural gas and petroleum-based products. EIA data show that was about 1.8% more than the roughly 4.8 billion metric tons that were emitted from consuming those energy sources in 2024.
But, as of July, the EIA’s outlook was that energy-related CO2 emissions would total more than 4.8 billion metric tons in all of 2026 — which would be down from just over 4.9 billion in 2025.
Food Stamps
The number of people accessing benefits from the Supplemental Nutrition Assistance Program, formerly known as food stamps, continued to decline.
Preliminary figures from the Department of Agriculture show more than 37 million people participating in SNAP as of April, the most recent data available. That was down by over 5.8 million, or about 13.6%, from the more than 42.8 million receiving food benefits in January 2025. (The USDA notes that data for some months may include individuals receiving disaster assistance.)
The decrease accelerated after Trump signed the Republican-passed One Big Beautiful Bill Act, which changed eligibility requirements for nutrition assistance and is estimated to reduce federal spending on the program. For example, the law extends work requirements to include “able-bodied adults without dependents” aged 55 to 64, who were previously exempt.
Debt and Deficits
Debt — The public debt, which excludes money the government owes itself, increased further after our last update. It went up by roughly $633.7 billion to more than $31.9 trillion, according to Treasury data as of July 24. Now the public debt is up about 10.7% since Trump has been back in the White House. It increased by one-third when Biden was president.
Deficits — The federal deficit is on track to go up this fiscal year – which will of course increase the debt. The Congressional Budget Office estimates that the deficit thus far for fiscal year 2026 is higher than it was at this time in fiscal 2025, when the deficit approached $1.8 trillion for the full year.
Through the first nine months of the current fiscal year (October to June), the deficit was about $1.4 trillion, or “$35 billion more than the deficit recorded during the same period last fiscal year,” the CBO reported in its latest Monthly Budget Review. In that time, federal revenues increased by $142 billion but outlays increased by $178 billion.
In February, the CBO projected that the deficit for FY 2026 would rise to nearly $1.9 trillion for the year.
Judiciary Appointments
Supreme Court — During Trump’s second term, there have been no vacancies on the high court. Biden had won confirmation for one justice, Ketanji Brown Jackson, by this point of his presidency.
Court of Appeals — As of July 27, Trump has had 10 U.S. Court of Appeals nominees approved, while 17 had been confirmed at the same point of Biden’s term.
District Court — Also, 43 of Trump’s nominees for District Court judges have been confirmed. At the same point of Biden’s term, 56 judges had been confirmed.
One judge for the Court of International Trade has been confirmed under Trump. At this point under Biden, two U.S. Court of Federal Claims judges were confirmed. None has been confirmed under Trump.
As of July 27, there were no vacancies for Court of Appeals judges and 24 for District Court judges with four nominees pending.
Sources
We provide links to the sources for these statistics throughout the article.
Editor’s note: FactCheck.org does not accept advertising. We rely on grants and individual donations from people like you. Please consider a donation. Credit card donations may be made through our “Donate” page. If you prefer to give by check, send to: FactCheck.org, Annenberg Public Policy Center, P.O. Box 58100, Philadelphia, PA 19102.