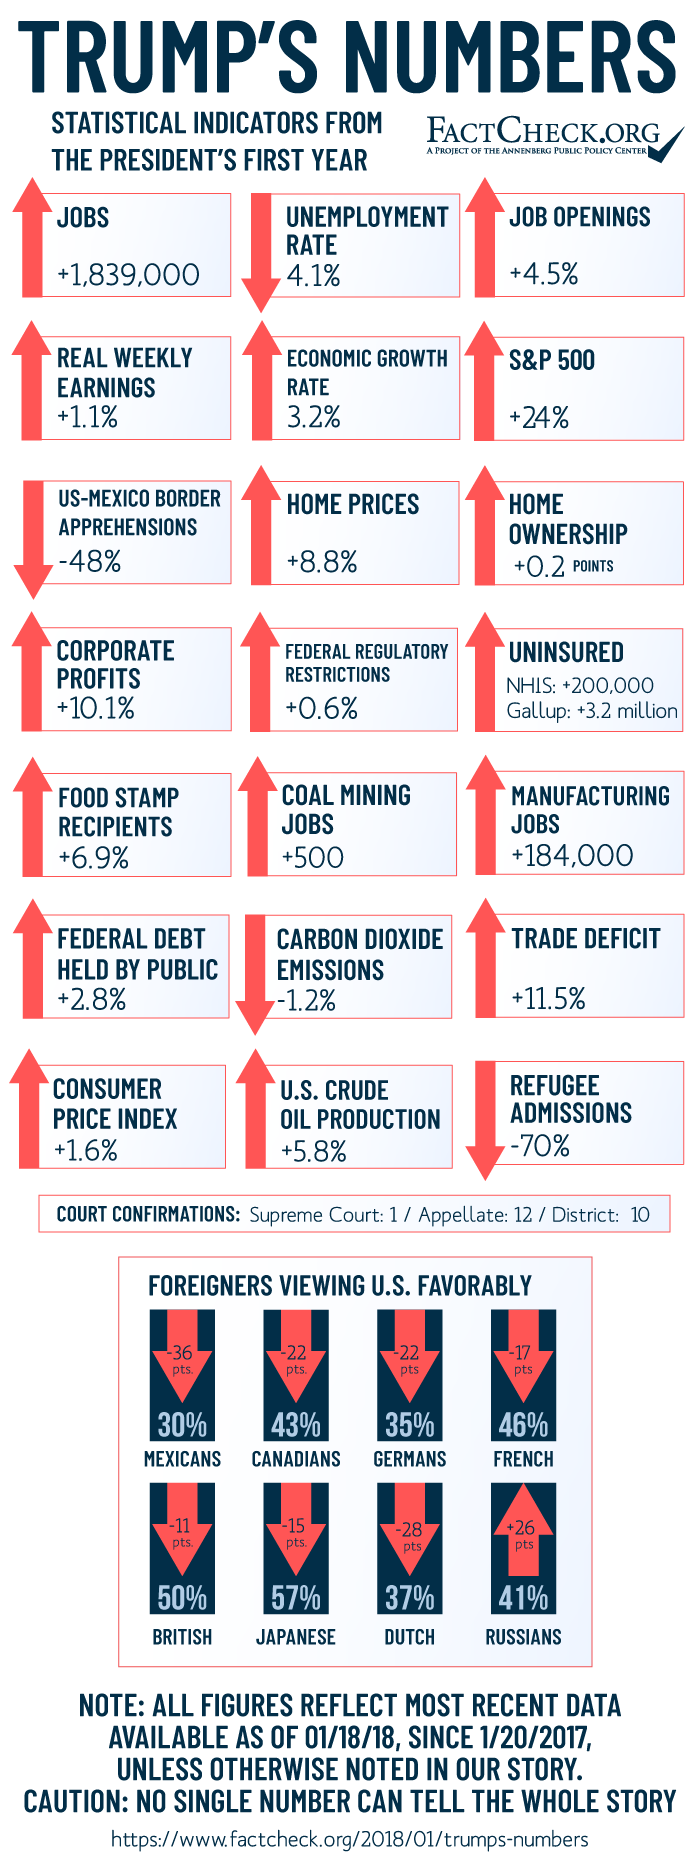
Summary
Now that President Donald Trump has been in office for one day shy of a full year, it’s time to take a look at how well his boasts — and his critics’ complaints — stack up against hard data.
Here we offer key measures of what has happened since Trump was sworn in on Jan. 20, 2017, according to the most up-to-date and reliable statistical sources available. Some highlights:
- Employment growth slowed by 12 percent. Nevertheless, the unemployment rate kept dropping, reaching a 17-year low. The number of job vacancies rose, also to a nearly 17-year record.
- Economic growth picked up to a 3.2 percent annual rate in the July-September quarter from 1.5 percent for all of 2016.
- The number of people caught trying to cross the border with Mexico fell by nearly half.
- The number of refugee admissions fell by 70 percent.
- Restrictions in the federal regulatory rulebook continued to grow, but at less than half the pace during the two previous administrations.
- The number of coal mining jobs, which Trump promised to bring back, went up by only 500. Manufacturing jobs grew just a bit faster than total employment.
- Real weekly wages rose 1.1 percent. Corporate profits and stock prices hit new records.
- The number of people without health insurance went up — by 200,000 according to a government survey, and by 3.2 million according to a more recent Gallup poll.
- The U.S. trade deficit that Trump promised to bring down grew instead, getting 11.5 percent larger.
- The number of people on food stamps, which Trump wants to cut, grew by nearly 3 million.
- The federal debt rose nearly 3 percent; projected annual deficits worsened.
- Trump won confirmation for a dozen federal appeals court judges — quadruple the number Obama put on the bench during his first year.
- The U.S. image abroad took a hit. The number of foreigners telling pollsters they have a favorable view of the USA fell nearly everywhere. The only big gain was in Russia.
The stories behind each of these quick summary figures, plus hyperlinks to the official sources, are contained in the Analysis section.
Analysis
As we did when we posted our first “Obama’s Numbers” article more than five years ago — and in the quarterly updates and final summary that followed — we’ve included statistics that may seem good or bad or just indifferent, depending on the reader’s point of view.
We’ll say again, opinions will differ on how much credit or blame a president deserves for things that happen during his time in office. And we urge readers to be aware that some changes that have happened already won’t show up in statistics until later updates. FBI crime figures for all of last year aren’t due until September, for example. Poverty and household income figures for 2017 won’t be available until later this year. We’ll cover those and more in quarterly updates to come.
Jobs and Unemployment
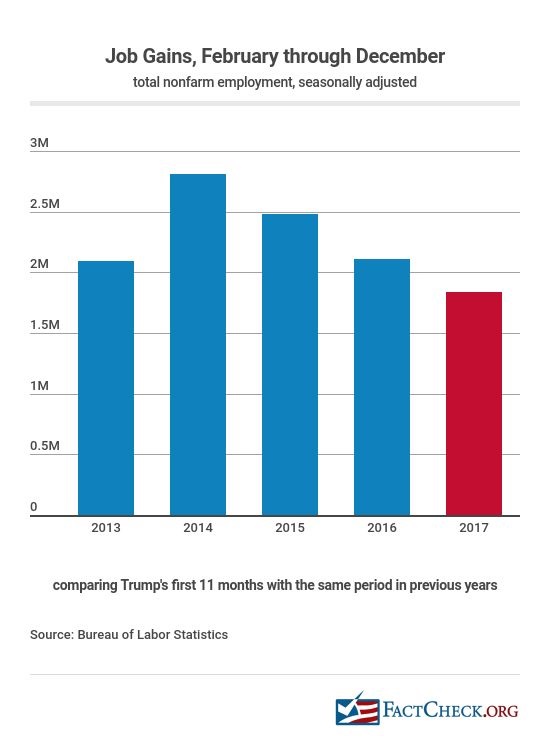
Since Trump took office, job growth has slowed. Job-seekers became more scarce, and employers struggled to find workers.
Employment — Total nonfarm employment grew by 1.84 million during the president’s first 11 months in office, according to the most recent figures available from the Bureau of Labor Statistics.
It’s a respectable gain, to be sure. But it’s 12 percent lower than the 2.01 million jobs that were created in the 11 months before he entered office.
The average monthly job gain under Trump is now 167,182, well behind the average monthly gain of 216,958 jobs during Obama’s entire second term. It’s also well shy of the pace required to meet his goal of 25 million new jobs over 10 years.
Trump will have to pick up the pace if he is to fulfill his campaign boast that he will be “the greatest jobs creation president that God ever created.”
Unemployment — One reason for the slowdown: fewer job-seekers. The unemployment rate — which was well below the historical norm when Trump took office — has continued to fall even lower, to the lowest point in 17 years.
The rate was 4.8 percent when he was sworn in, and Janet Yellen, chair of the Federal Reserve, said the economy already was close to what economists consider “full employment.”
Under Trump, the jobless rate fell further — to 4.1 percent in October, November and December. That’s the lowest the rate has been since it hit 3.9 percent for four months in 2000, at the end of the dot-com boom.
The rate also is well below the historical norm of 5.6 percent, which is the median monthly rate for all the months since the start of 1948. The lowest unemployment rate ever recorded was in 1953, when the rate was 2.5 percent for a couple of months.
Job Openings — Another reason employment growth has slowed is a continuing shortage of workers. The number of unfilled job openings hit a new record of nearly 6.2 million in September — the most in the nearly 17 years the Bureau of Labor Statistics has been tracking them.
That figure dropped back to 5.9 million in November, the most recent month for which the BLS has released figures. But that was still 254,000 (or 4.5 percent) higher than in January, when Trump took office.
Labor Force Participation — The labor force participation rate also resumed its decline under Trump, edging down 0.2 percentage points between January and December.
To be sure, this is not very significant. We mention it because Republicans often criticized Obama for the 2.8 percentage point decline that occurred during his eight years, even though the decline was (and is) due mostly to the post-World War II baby boomers reaching retirement age, and other demographic factors beyond the control of any president. (The rate is the portion of the entire civilian population age 16 and older that is either employed or currently looking for work.)
The rate under Trump has fluctuated, going from 62.9 percent when he took office to 63.0 percent in March (and again in September), and then down to 62.7 percent in October, November and December.
Manufacturing Jobs — The number of manufacturing jobs rose under Trump.
The number of manufacturing jobs recorded in December, 12.5 million, was 184,000 (or 1.5 percent) higher than when Trump took office. In the preceding 11 months, the number went down by 20,000. The increase under Trump is a little better than the 1.3 percent gain in total nonfarm employment.
Economic Growth
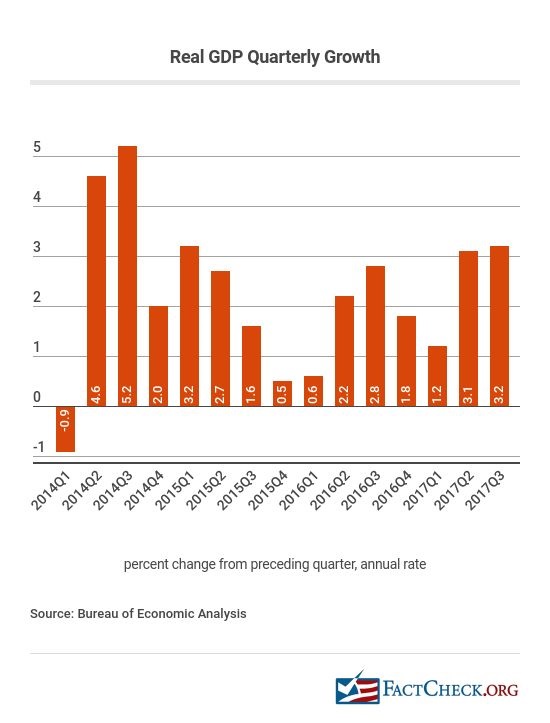
The economy is growing faster under Trump.
The economy grew at an annual rate of 3.2 percent during the third quarter of 2017, according to the most recent official estimate by the Bureau of Economic Analysis.
That 3.2 percent growth-rate estimate is more than double the 1.5 percent growth recorded for the full year of 2016. And it’s even higher than the 2.9 percent real growth recorded in 2015, the best full-year figure for the Obama years.
It remains to be seen whether growth in the final three months of 2017 continued at the 3.2 percent rate. The Bureau of Economic Analysis releases its first, preliminary estimate for the fourth quarter and all of 2017 on Jan. 26. Currently the “GDP Now” forecast produced by the Federal Reserve Board of Atlanta projects that the fourth quarter rate will come in at a 3.4 percent rate.
Trump has promised that the tax cuts he signed into law Dec. 22 will be “rocket fuel” for the economy, and that growth “could go to 4, 5, and maybe even 6 percent, ultimately.” Few economists agree. The nonpartisan staff of the Joint Committee on Taxation forecasts that the tax cuts will boost annual GDP growth by an average of 0.7 percent each year for the first decade, and less thereafter. In its most recent forecast, the Congressional Budget Office predicted real GDP growth of 2.2 percent in 2018. Adding 0.7 to that would bring growth to 2.9 percent.
Regulations
The growth of federal regulation slowed significantly under Trump, though it hasn’t yet come to the “sudden, screeching and beautiful halt” he claims.
The number of restrictive words and phrases (such as “shall,” “prohibited” or “may not”) contained in the Code of Federal Regulations rose by 6,973 between the day Trump was sworn in and Jan. 16, 2018, according to daily tracking done by the QuantGov project at George Mason University’s Mercatus Center.
That’s an increase of 0.6 percent since he took office, which is well below the average annual growth under each of his two most recent predecessors. Annual QuantGov tracking figures show the average increase in restrictive words in the CFR was just under 1.5 percent during both the Obama years and the George W. Bush years.
The Mercatus Center database provides a hard count of specific legal mandates and prohibitions imposed by federal regulators, which we find to be more relevant than counts of the number of pages or words in the rulebook. It doesn’t attempt to assess the cost or benefit of any particular rule — such assessments require a degree of guesswork and are sensitive to assumptions. But it does track the sheer volume of federal rules with more precision than we have found in other metrics.
At a Dec. 14 event at the White House, Trump said, “We’ve begun the most far-reaching regulatory reform in American history.” A White House fact sheet said that since Trump took office federal agencies had “withdrawn or delayed 1,579 planned regulatory actions.”
Some are quite significant. Within a month of taking office, for example, Trump signed a law nullifying an Obama-era rule prohibiting coal mining companies from dumping waste into streams and waterways.
Coal and Environment
Coal Mining Jobs — As a candidate, Trump promised to “put our [coal] miners back to work,” but so far not many have regained their jobs.
A total of 36,400 coal mining jobs disappeared during the Obama years, but as of December only 500 of them had come back under Trump, according to BLS figures.
The number employed in coal mining stood at 50,000 when Trump was sworn in, rose to 51,700 in September, but then slipped back to 50,500 in December. (The BLS rounds employment figures to the nearest 100.)
The outlook for coal miners remains bleak. The U.S. Energy Information Administration currently projects that U.S. coal production will decline in 2018 and 2019. EIA expects there will be less demand for exports, and increased use of natural gas to generate electricity.
Coal Mining Deaths — The number of workers who died in coal mining accidents remained low under Trump; there were 15 deaths in 2017, the third lowest on record.
That came after a record low of eight deaths in 2016. Those seven additional deaths amounted to an 87 percent increase, prompting some overly dramatic headlines. But 48 miners died in 2010, the worst year of the Obama administration, including 29 who perished in a coal dust explosion at the Upper Big Branch mine near Charleston, West Virginia.
Carbon Emissions — Carbon dioxide emissions from energy consumption continued going down under Trump. During his first eight full months in office, the U.S. put 1.2 percent less of the greenhouse gas into the atmosphere from burning coal, natural gas, gasoline and other petroleum products, according to the most recent estimates available from the Energy Information Administration.
In October, EIA posted an analysis saying carbon emissions were expected to fall for the full year in 2017 for the third straight year. EIA also projected carbon emissions to rise 2.2 percent in 2019 — not due to any policy changes, but largely due to more demand for heating and cooling.
Border Security
A key measurement of illegal immigration declined sharply under Trump.
The number of people caught while illegally trying to cross the U.S. border with Mexico dropped 48 percent during Trump’s first full 11 months in office, compared with the same period in 2016, according to the most recent and historical figures released by U.S. Customs and Border Protection.
The number of apprehensions plunged to a low of 11,127 in April, but then climbed to around 29,000 in November and December. But every month under Trump was well below the monthly average of 36,912 in 2016.
To be sure, the number of apprehensions is an imperfect measure of total illegal immigration, because nobody knows how many succeed in crossing the border illegally without being caught. Nevertheless, authorities and news media use apprehensions as a measure of trends in illegal immigration, on the assumption that the ratio of those who are caught to those who are not remains fairly constant.
The drop in apprehensions comes despite the fact that Trump’s promised border wall is still not built, or even begun. CBP is testing eight sample wall designs in San Diego, but so far Congress hasn’t approved funding for construction (and Mexico says it isn’t paying, either).
Meanwhile, arrests and deportations of those already here illegally are on the rise, according to U.S. Immigration and Customs Enforcement.
ICE states that its enforcement officers made 110,568 administrative arrests between Trump’s inauguration on Jan. 20 and Sept. 30, the end of fiscal year 2017, representing a 42 percent increase over the same period in 2016. ICE also reported the number of “interior removals” (deportations) increased 37 percent, to 61,094 during the same period. (This does not count those returned after being caught at or near the border. Counting those, total removals actually decreased, due to the drop in apprehensions.)
ICE also is moving aggressively against businesses that employ immigrants living in the country illegally. In September a federal court ordered the Asplundh Tree Experts Company to pay $95 million for employing thousands of immigrants who aren’t authorized to work in the U.S. And on Jan. 10, ICE agents raided 98 7-Eleven convenience stores and arrested 21 people in what the acting director, Thomas D. Homan, said was meant as “a strong message to U.S. businesses that hire and employ an illegal workforce.”
Refugees
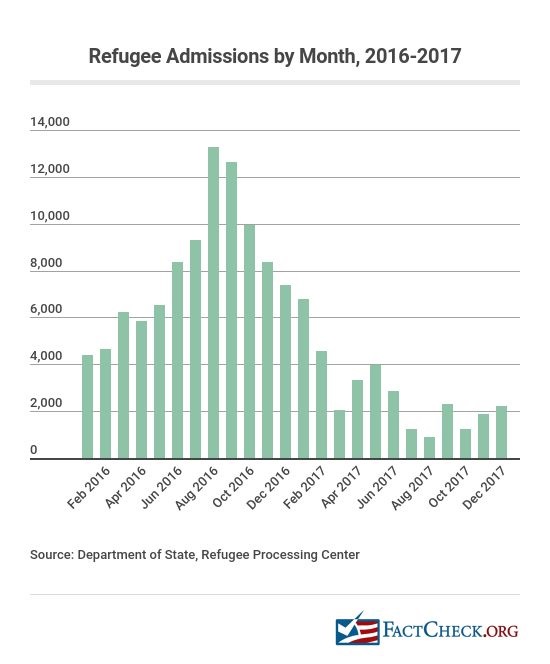
Refugee admissions went down 70 percent under Trump. From Jan. 20, 2017, to Jan. 18, 2018, 29,722 refugees were admitted to the U.S. under Trump. During the same time frame in 2016-2017 under Obama, 98,266 were admitted.
The number of refugees admitted into the country has varied widely over the past several decades (see this chart from the Migration Policy Institute). Under Obama, the low point for admissions in a fiscal year was 56,424 in 2011. All of these figures come from the State Department’s Refugee Processing Center.
Admissions can depend on world events, such as the civil war in Syria, which has caused millions to flee the country, according to the United Nations High Commissioner on Refugees. But it’s up to the president each year to issue a determination on the total number of refugees the United States could accept.
The Obama administration had upped its fiscal year limit to 110,000 for fiscal 2017, which began Oct. 1, 2016. And the numbers were nearly on pace to reach that maximum before Trump took office. But monthly admissions then plummeted.
The Trump administration, which has issued executive orders halting refugee admissions and instituting new criteria, announced a limit of 45,000 for fiscal 2018, the lowest yearly limit instituted under the procedures set by the Refugee Act of 1980.
Corporate Profits
Corporate profits surged under Trump, hitting a record annual rate of nearly $1.86 trillion in the third quarter of 2017.
That figure for after-tax profits comes from the Bureau of Economic Analysis and is the most recent available. It’s 10.1 percent higher than the full-year figure for 2016.
After-tax profits are expected to get a further boost in 2018, when the top federal tax rate on corporate income falls to 21 percent, from 35 percent, under the tax bill Trump signed into law Dec. 22.
Stock Market
Stock prices continued their long rise under Trump, setting record after record.
In the year since Trump took office, the Standard & Poor’s 500-stock average has gained another 24 percent, after going up 166 percent during Obama’s eight years. (We measure from the close on the last trading day prior to inauguration.)
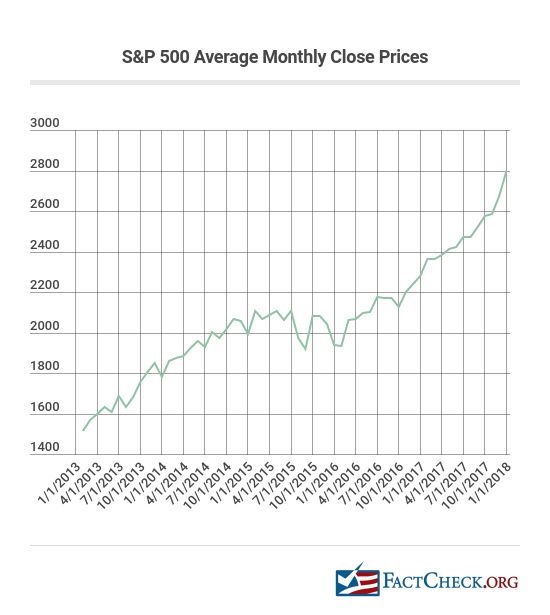
Other indexes posted even bigger gains. The Dow Jones Industrial Average, made up of 30 large corporations, was up 32 percent during Trump’s first year, (after rising 138 percent under Obama). And the NASDAQ Composite index, made up of more than 3,000 companies, also rose 32 percent (after going up 262 percent under Obama).
The bull market that began in March 2009, at the depths of the Great Recession, is now nearing its ninth anniversary, and is the second longest on record.
Wages and Inflation
The upward trend in wages continued under Trump, while prices continued to rise slowly.
CPI — The Consumer Price Index rose 1.6 percent during Trump’s first 11 months, continuing a period of historically low inflation.
The CPI rose an average of 6.8 percent each year during the 1970s, 5.7 percent during the 1980s, eased down to 3.1 percent during the 1990s and 2.1 percent in the next decade (measuring the 12-month change ending in December each year). Since 2010 that average 12-month increase has been 1.8 percent.
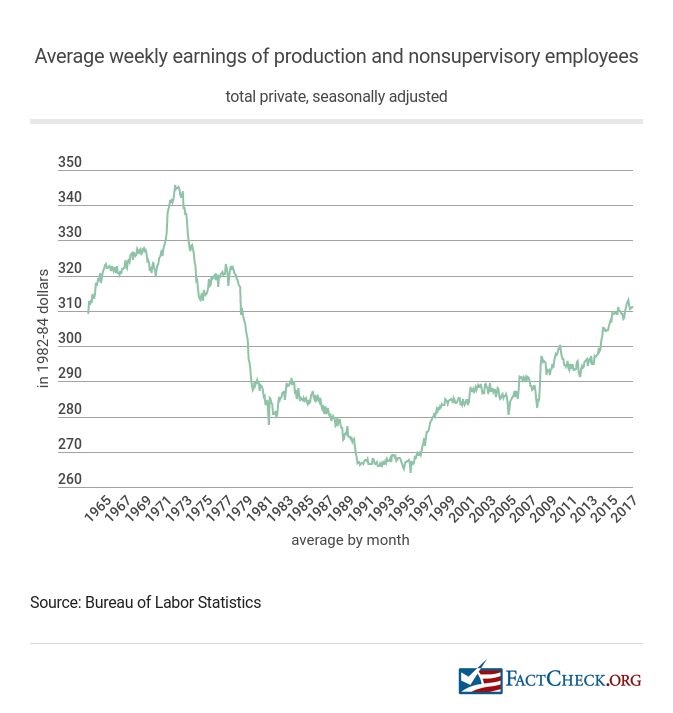
Wages — The purchasing power of weekly paychecks resumed its rise during Trump’s first 11 months. The average weekly earnings of all private-sector workers, in “real” (inflation-adjusted) terms, rose 1.1 percent, after going down 0.4 percent during the previous 11 months.
Real wages have been on a generally upward path since the 1990s, after tanking in the 1970s and 1980s. During Obama’s eight years, they rose 4.1 percent for all workers.
Those figures for all workers include managers and supervisors, and only go back to 2006. For longer-term trends we rely on BLS’ figures for rank-and-file production and non-supervisory workers, who make up 82 percent of private-sector workers.
In December, their real earnings were 18 percent higher than they were in January 1996, the recent low point. But they have yet to regain their high point; they’re still 10 percent below their peak in October 1972.
Consumer Sentiment
Consumer confidence in the economy turned less optimistic at the end of Trump’s first year.
The University of Michigan’s Survey of Consumers reported that its preliminary Index of Consumer Sentiment sank in January to 94.4, a drop of 4.1 points since Trump took office.
The index is closely watched as an indicator of how likely consumers are to spend money.
It has waxed and waned during Trump’s time, going as high as 100.7 in October, the highest point since January 2004, before dropping in November, December and January.
The survey said that despite “largely positive view of the tax reform” recently signed by Trump, the tax plan is creating some uncertainty among consumers. The survey noted “uncertainties about the delayed impact of the tax reforms,” especially among high-income consumers who live in high-tax states. The new law limits deductions for state and local taxes, and will result in higher federal taxes for some.
Home Prices & Ownership
Home Prices — Home prices have continued to rise and set new highs under Trump.
The most recent sales figures from the National Association of Realtors show the national median price of an existing, single-family home sold in November was $248,800, up 8.8 percent since January. The median price was even higher earlier in the year, hitting a record $265,500 in June. The total number of homes sold in November (including condominium and cooperative apartments) was the highest in nearly 11 years, the Realtors reported.
Home Ownership — Meanwhile the number of people who own homes has continued to recover from a years-long slide, gaining 0.2 percentage points.
The home ownership rate peaked at 69.2 percent of households for two quarters in 2004, then lost 6.3 percentage points before bottoming out at 62.9 percent in the second quarter of 2016. That was the lowest point in more than half a century, and tied the lowest on record.
From there the rate recovered to 63.7 percent in the last quarter of 2016. After Trump took office, it edged up to 63.9 percent in the third quarter of 2017, according to the most recent Census Bureau figures.
Trade
The trade deficit that Trump promised to reduce grew larger.
Census figures show the U.S. imported nearly $465 billion more in goods and services than it exported during Trump’s first full 10 months in office. That gap was $48 billion, or 11.5 percent, higher than in the same period in 2016.
China — The trade deficit in goods with China grew by 7.8 percent during the period. Trump didn’t label China a “currency manipulator” as he had promised to do, and instead began praising China’s leader, Xi Jinping, as “a very special man” during a trip to Bejing on Nov. 9. “I look forward to building an even stronger relationship between our two countries,” Trump said.
Mexico — Meanwhile, the trade deficit in goods with Mexico grew by 11 percent. Trump’s negotiations to alter the North American Free Trade Agreement with Mexico and Canada are currently bogged down. They are set to resume in Montreal on Jan. 23.
Health Insurance Coverage
The number of people lacking health insurance went up.
The most recent report from the National Health Interview Survey estimates that during the first six months of last year 28.8 million people were uninsured. That’s an increase of only 200,000 people from 2016, and still 19.8 million fewer than were uninsured in 2010, the year Obama signed the Affordable Care Act.
More recent polling by the Gallup organization found an even larger increase in the uninsured — estimating that 3.2 million Americans entered the ranks of the uninsured in 2017.
Gallup’s polling covered the last three months of 2017 and is based on interviews with 25,000 adults.
Trump conspicuously failed to “repeal and replace” Obama’s Affordable Care Act as he promised to do. But in December, he signed a tax bill that will end Obamacare’s tax penalty for people who fail to obtain coverage. That becomes effective in 2019.
Repealing the mandate will increase the number of uninsured by millions, according to an estimate by the nonpartisan Congressional Budget Office. CBO projects that ending the mandate will cause 4 million people to lose or drop coverage in 2019, rising to 12 million two years later and 13 million in 2025.
CBO said that ending the mandate would cause policy premiums for those buying individual policies to rise 10 percent in most years. “[H]ealthier people would be less likely to obtain insurance and … the resulting increases in premiums would cause more people to not purchase insurance,” CBO said.
Food Stamps
Ironically, the number of food stamp recipients went up under Trump — even as he proposed to cut the program.
As of October, the most recent month for which figures are available, more than 45.6 million people were receiving the aid, the highest number since March 2015. The number has gone up nearly 3 million, or 6.9 percent, since January when Trump took office.
Now known as the Supplemental Nutrition Assistance Program, or SNAP, the program was greatly expanded under President George W. Bush, during whose time 14.7 million beneficiaries were added, swelling the rolls by 85 percent. The rolls grew by another 33 percent during Obama’s time, when a net total of 10.7 million more were added.
The number peaked at nearly 47.8 million in December 2012, during the long and painful recovery from the Great Recession of 2007-2009. From there it drifted downward during Obama’s last term, as the economy recovered and incomes improved.
That decline in food stamp recipients continued and accelerated during the first seven months of Trump’s administration — going down by more than 1.6 million between January and August, nearly double the rate of Obama’s last seven months, when 860,000 went off the SNAP rolls.
But then in August, Hurricane Harvey caused devastating flooding in Texas, and soon after Hurricanes Irma and Maria devastated Puerto Rico, the U.S. Virgin Islands and the Florida Keys. Meanwhile wildfires raged in eight Western states. Food stamps were part of the federal government’s disaster relief efforts. Between August and October, nearly 4.6 million people were added to the SNAP rolls, leaving a net gain of just under 3 million under Trump so far.
Judiciary Appointments
Trump is putting his mark on the federal courts faster than Obama was able to do in his first months.
Supreme Court — So far Trump has won Senate confirmation for one Supreme Court nominee, Justice Neil Gorsuch. Obama also was able to fill one high court vacancy during his first year, with Justice Sonia Sotomayor.
Court of Appeals — But as of Jan. 17, Trump also had won confirmation for 12 U.S. Court of Appeals judges — four times as many as Obama at the same point in his first term. (Obama later won confirmation of his fourth appeals court judge — one minute after noon on Jan. 20, 2010, and thus one minute into his second year in office.)
District Court — Ten of Trump’s nominees to be federal District Court judges have been confirmed, one more than the nine for whom Obama had won confirmation at the same point in his presidency.
More nominations are working their way toward the Senate floor in coming days. On Jan. 18, the Senate Judiciary Committee cleared the nominations of 17 more Trump appointees, including three named to be appellate judges.
Federal Debt and Deficits
Trump inherited rising federal debt and deficits, and his tax cut is projected to make both rise faster.
The federal debt held by the public stood at more than $14.8 trillion at the last count on Jan. 17, up 2.8 percent under Trump. And that figure will go up even faster in coming years unless Trump and Congress impose massive spending cuts.
The annual federal deficit for fiscal year 2017 (which ended Sept. 30 and was largely the result of spending and taxes set under Obama) was nearly $666 billion, up from just under $586 billion the year before.
The nonpartisan Congressional Budget Office had expected that deficit to drop a bit in the current year before resuming an indefinite upward path. But Trump’s cuts in corporate and individual income tax rates stand to cause the red ink to gush even faster.
On Jan. 2, CBO officially estimated that the tax cuts would cause the deficit for the current fiscal year to rise to $699 billion, and continue rising for the foreseeable future, exceeding $1 trillion annually starting in FY2020.
CBO’s estimates don’t include any allowance for increases in economic growth resulting from the tax cuts. However, blending the results from three different computer models of the economy, the nonpartisan Joint Committee on Taxation officially estimated on Dec. 22 that the expected increase in growth would be 0.7 percent annually, as previously mentioned. It also calculated that added growth would increase government revenues and reduce the projected deficits by a total of only $32 billion in the current fiscal year, and an average of $38.5 billion annually for the next decade.
Oil Production and Imports
U.S. crude oil production resumed its upward trend, rising 5.8 percent to an average of 9.3 million barrels per day during Trump’s first full 11 months in office, compared with the same period in 2016.
Domestic oil production increased every year since 2008, except for a 5.6 percent drop in 2016 after prices plunged to below $30 a barrel, from over $100 previously. The price returned to over $50 a barrel by the end of 2016, calling forth increased drilling and production.
As a result, the trend to reduced reliance on foreign oil also resumed. During the first 11 months of 2017 the U.S. imported only 19.6 percent of its oil and petroleum products, down from 24.4 percent in 2016. That figure peaked in 2005, when the U.S. imported 60.4 percent of its petroleum, and has declined every year since except for 2016, when it ticked up by 0.3 percentage points.
U.S. Image Abroad
The U.S. image abroad has suffered under Trump.
Polling by the Pew Research Center in 37 countries after Trump took office shows a median figure of only 49 percent said they had a favorable view of the United States, down 15 percentage points from the end of the Obama presidency.
Not surprisingly, one of the worst declines was among Mexicans, whom Trump said he would bill for his promised border wall. Only 30 percent of Mexicans now view the U.S. favorably, down by a full 36 percentage points under Trump.
To the north, only 43 percent of Canadians view the U.S. favorably, down 22 percentage points. Among NATO allies, the U.S. favorability rating dropped 22 points among Germans, to 35 percent. It is down 17 points among the French, to 46 percent, is down 28 percent among the Dutch, to 37 percent, and is down 11 points among the British, only half of whom now view the U.S. favorably.
Fifty-seven percent of Japanese still view the U.S. favorably, but that figure is down 15 points from where it was under Obama. And 81 percent of Israelis still view the U.S. favorably, unchanged from the end of Obama’s time.
The only big improvement was among Russians. Pew’s polling found 41 percent of Russians now view the U.S. favorably, an increase of 26 points under Trump.
— by Brooks Jackson, with Lori Robertson
Correction, May 16, 2018: The average monthly gain in jobs during Obama’s second term was 216,958 (not 213,708 as we reported originally due to a miscalculation). We have corrected the figure and regret the error.
Sources
Bureau of Labor Statistics. “Employment, Hours, and Earnings from the Current Employment Statistics survey (National); Total Nonfarm Employment, Seasonally Adjusted.” Data extracted 18 Jan 2018.
Bureau of Labor Statistics. “Labor Force Statistics from the Current Population Survey; Unemployment Rate, Seasonally Adjusted.” ” Data extracted 18 Jan 2018.
Bureau of Labor Statistics. “Job Openings and Labor Turnover Survey: Job Openings, Seasonally Adjusted.” Data extracted 18 Jan 2018.
Bureau of Labor Statistics. “Labor Force Statistics from the Current Population Survey; Labor Force Participation Rate.” Data extracted 18 Jan 2018.
Bureau of Labor Statistics. “Labor Force Statistics from the Current Population Survey; All employees, thousands, manufacturing, seasonally adjusted” Data extracted 18 Jan 2018.
U.S. Bureau of Economic Analysis. “National Income and Product Accounts, Gross Domestic Product: Third Quarter 2017 (Third Estimate) Corporate Profits: Third Quarter 2017 (Revised Estimate) News release. 21 Dec 2017.
U.S. Bureau of Economic Analysis. “Table 1.1.1. Percent Change From Preceding Period in Real Gross Domestic Product” Interactive data extracted 18 Jan 2018.
U.S. Congress, Joint Committee on Taxation. “Macroeconomic Analysis Of The Conference Agreement For H.R. 1, The “Tax Cuts And Jobs Act” 22 Dec 2017.
U.S. Congress, Congressional Budget Office. “June 2017 Baseline Forecast—Data Release (Calendar Year” Data supplementing “An Update to the Budget and Economic Outlook: 2017 to 2027” 29 June 2017.
McLaughlin, Patrick A., and Oliver Sherouse. 2017. “QuantGov—A Policy Analytics Platform.” Daily Summary tracking of restrictions in the eCFR (Electronic Code of Federal Regulations). Downloaded 18 Jan 2018.
McLaughlin, Patrick A., and Oliver Sherouse. 2017. “QuantGov—A Policy Analytics Platform.” “RegData 3.0 Restrictions by Year.” Downloaded 18 Jan 2018.
Bureau of Labor Statistics. “Labor Force Statistics from the Current Population Survey; All employees, thousands, coal mining, seasonally adjusted” Data extracted 18 Jan 2018.
U.S. Energy Information Administration. Short Term Energy Outlook. 9 Jan 2018.
U.S. Department of Labor, Mine Safety and Health Administration. “Coal Mining Fatalities by State by Calendar Year” 3 Jan 2018, accessed 18 Jan 2018.
U.S. Department of Labor, Mine Safety and Health Administration. “Coal Fatalities for 1900 through 2017” undated, accessed 18 Jan 2018.
Urbina, Ian. “No Survivors Found After West Virginia Mine Disaster” New York Times. 9 Apr 2010.
U.S. Border Patrol. “U.S. Border Patrol Apprehensions FY2018 YTD(October 1 – December 31).” Undated. Accessed 18 Jan 2018.
U.S. Border Patrol. “Total Illegal Alien Apprehensions By Month Fiscal Years 2000-2017.” Undated. Accessed 18 Jan 2018.
Rodriguez, Nicole. “Border Agents Batter Trump’s Wall Samples With Jackhammers to Test Vulnerabilities.” Newsweek. 6 Dec 2017.
U.S. Immigration and Customs Enforcement. “ICE Impact in FY 2017” Undated web page, accessed 18 Jan 2018.
U.S. Immigration and Customs Enforcement. “Fiscal Year 2017 ICE Enforcement and Removal Operations Report” Undated web page, accessed 18 Jan 2018.
Rubinkam, Michael. “Tree company Asplundh to pay record fine for immigration practices”The Associated Press. 29 Sep 2017.
Ballesteros, Carlos “ICE Raids 100 7 Eleven Stores–And the Trump Administration Says It’s Just Getting Started” Newsweek. 10 Jan 2018.
U.S. Immigration and Customs Enforcement. “Statement from ICE Deputy Director Thomas D. Homan on 7-Eleven Operation” news release, 10 Jan 2018.
State Department. Refugee Processing Center. Admissions and Arrivals. accessed 18 Jan 2018.
State Department. Refugee Processing Center. Summary of Refugee Admissions. accessed 18 Jan 2018.
United Nations. Syria emergency. United Nations High Commissioner on Refugees. accessed 18 Jan 2018.
Bruno, Andorra. “Refugee Admissions and Resettlement Policy.” Congressional Research Service. 7 Nov 2017.
Eilperin, Juliet. “White House raises refugee target to 110,000.” Washington Post. 14 Sep 2016.
Connor, Phillip and Krogstad, Jens Manuel. “U.S. on track to reach Obama administration’s goal of resettling 110,000 refugees this year.” Pew Research Center. 20 Jan 2017.
Wadhams, Nick. “Trump Sets Annual Refugee Limit at 45,000, the Lowest in Decades.” Bloomberg News. 27 Sep 2017.
U.S. Bureau of Economic Analysis. “Corporate Profits After Tax (without IVA and CCAdj)” (NIPA Table 1.12, line 45) 21 Dec 2017.
Yahoo! Finance. “Dow Jones Industrial Average” Accessed 18 Jan 2018.
Yahoo! Finance. “S&P 500” Accessed 18 Jan 2018.
Yahoo! Finance. “NASDAQ Composite” Accessed 18 Jan 2018.
Santoli, Michael. CNBC.com “Second-longest bull market ever aging gracefully, but investors wonder how long it will last” 14 Sep 2017.
Bureau of Labor Statistics. “Consumer Price Index – All Urban Consumers.” Data extracted 18 Jan 2018.
Bureau of Labor Statistics. “Employment, Hours, and Earnings from the Current Employment Statistics survey (National); Average Weekly Earnings of All Employees, 1982-1984 Dollars.” Data extracted 18 Jan 2018.
Bureau of Labor Statistics. “Employment, Hours, and Earnings from the Current Employment Statistics survey (National); Average Weekly Earnings of production and nonsupervisory employees, 1982-1984 Dollars.” Data extracted 18 Jan 2018.
University of Michigan Surveys of Consumers. “The Index of Consumer Sentiment” 19 Jan 2018.
National Association of Realtors. “Sales Price of Existing Single-Family Homes.” 20 Dec 2017.
National Association of Realtors. “Existing-Home Sales Soar 5.6 Percent in November to Strongest Pace in Over a Decade” 20 Dec 2017.
U.S. Census Bureau. “Time Series: Not Seasonally Adjusted Home Ownership Rate.” Data extracted 18 Jan 2018.
U.S. Census Bureau. “U.S. International Trade in Goods and Services, Balance of Payments, Seasonally Adjusted” monthly data extracted 18 Jan 2018.
U.S. Census Bureau. “Trade in Goods with Mexico” monthly data extracted 18 Jan 2018.
U.S. Census Bureau. “Trade in Goods with China” monthly data extracted 18 Jan 2018.
Centers for Disease Control and Prevention; National Health Interview Survey. “Health Insurance Coverage: Early Release of Estimates From the National Health Interview Survey, January–June 2017.” 1 Nov 2017.
Auter, Jack “U.S. Uninsured Rate Steady at 12.2% in Fourth Quarter of 2017” Gallup News. 16 Jan 2018.
U.S. Congress, Congressional Budget Office. “Repealing the Individual Health Insurance Mandate:
An Updated Estimate” 8 Nov 2017.
U.S. Department of Agriculture, Food and Nutrition Service. “Supplemental Nutrition Assistance Program (Data as of Jan 5 2017).” Data extracted 18 Jan 2018.
U.S. Department of Agriculture, Food and Nutrition Service. Supplemental Nutrition Assistance Program (SNAP) data, fiscal years 1968-2017.
U.S. Department of Agriculture, Food and Nutrition Service. “Food Assistance for Disaster Relief” web page accessed 18 Jan 2018.
Administrative Office of the U.S. Courts, “Confirmation Listing; Judicial Confirmations; 115th Congress” web page accessed 18 Jan 2018.
Administrative Office of the U.S. Courts, “Judicial Confirmations for February 2010” archived web listing of confirmations in 110th Congress, accessed 18 Jan 2018.
U.S. Treasury. “The Debt to the Penny and Who Holds It.” Data extracted 18 Jan 2018.
U.S. Treasury. “Final Monthly Treasury Statement of Receipts and Outlays of the United States Government For Fiscal Year 2017 Through September 30, 2017” 20 Oct 2017.
U.S. Congress, Congressional Budget Office. “An Update to the Budget and Economic Outlook: 2017 to 2027” 29 Jun 2017.
U.S. Congress, Congressional Budget Office. “Estimated Deficits and Debt Under the Conference Agreement of H.R. 1” 2 Jan 2017.
U.S. Congress, Joint Committee on Taxation. “Macroeconomic Analysis Of The Conference Agreement For H.R. 1, The ‘Tax Cuts And Jobs Act’” 22 Dec 2017.
U.S. Energy Information Administration. “U.S. Crude Oil Production.” Short Term Energy Outlook. 9 Jan 2018. Data extracted 27 Sep 2017.
U.S. Energy Information Administration. “U.S. Field Production of Crude Oil” Annual data, accessed 18 Jan 2018.
U.S. Energy Information Administration. “Weekly Cushing OK WTI Spot Price FOB” Weekly oil price data, accessed 18 Jan 2018.
U.S. Energy Information Administration. “Table 3.3a Petroleum Trade: Overview.” Monthly Energy Review. 22 Dec 2017. Accessed 18 Jan 2018.
Wike, Richard and Bruce Stokes, Jacob Poushter And Janell Fetterolf, “U.S. Image Suffers as Publics Around World Question Trump’s Leadership” Pew Research Center. 26 Jun 2017.
Wike, Richard and Bruce Stokes, Jacob Poushter And Janell Fetterolf, “The tarnished American brand” Pew Research Center. 26 Jun 2017.
Pew Research Center, Global Indicators Database “Opinion of the United States: Do you have a favorable or unfavorable view of the U.S.?” Data accessed 18 Jan 2018.