Update, Jan. 9: We have updated these statistics to the most recent numbers available as of Jan. 9, 2019.
With the controversy over family separations, much of the political rhetoric in recent weeks has focused on illegal immigration. We thought it would be helpful to take a step back and look at some measures of illegal immigration in a larger context.
For example, how many immigrants live in the U.S. illegally, and how many are caught each year trying to cross the Southwest border? How many of them are families or unaccompanied children? And how have these statistics changed over time? Let’s take a look at the numbers.
How many immigrants are living in the U.S. illegally?
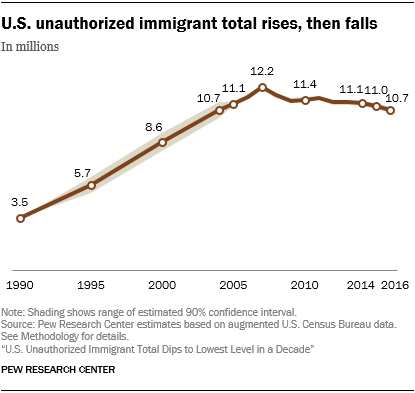
There were 12 million immigrants living in the country illegally as of January 2015, according to the most recent estimate from the Department of Homeland Security. The estimates from two independent groups are similar: The Pew Research Center estimates the number at 10.7 million in 2016, and the Center for Migration Studies says there were 10.8 million people in 2016 living in the U.S. illegally.
That would be about 3.3 percent to 3.7 percent of the total U.S. population in 2016 or 2015.
All three groups use Census Bureau data on the foreign-born or noncitizens and adjust to subtract the legal immigrant population.
DHS estimated that the growth of the illegal immigrant population had slowed considerably, saying the population increased by 470,000 per year from 2000 to 2007, but only by 70,000 per year from 2010 to 2015.
CMS found a decline in the undocumented population, and specifically those from Mexico, of about 1 million since 2010. And the Pew Research Center found a peak of 12.2 million in the population in 2007, and a decline since.
All three groups find Mexicans make up the majority of the undocumented population — 55 percent in 2015, according to DHS — but the number and share of Mexicans among this population has been declining in recent years.
Those living in the country illegally also have increasingly been here for 10 years or more. DHS says nearly 80 percent in 2015 have lived in the U.S. for more than a decade, and only 6 percent came to the country over the previous five years.
Update, June 7, 2019: After this story was originally published in June 2018, a study by researchers at Yale University and the Massachusetts Institute of Technology estimated that the illegal immigration population was much higher: an average 22.1 million for 2016. The researchers used a mathematical model with assumptions on immigration inflows and outflows to estimate the growth in the illegal immigration population from 1990 to 2016. Immigration experts, including those with the Migration Policy Institute, the Center for Migration Studies, the Center for Immigration Studies (a self-described “low-immigration, pro-immigrant” group) and the libertarian Cato Institute, have criticized the Yale study.
MPI said it was “based on seriously flawed assumptions,” and CIS said, “The findings are unsupportable.” One of the main criticisms is that the study didn’t adequately account for circular migration in the 1990s (people coming and going multiple times) and overestimated the number who remained in the U.S. The Center for Migration Studies’ Robert Warren, who was the director of the statistics division of Immigration and Naturalization Services from 1986 to 1995, wrote in his criticism that the apprehension rates the Yale researchers used for the 1990s were “purely speculative.” The estimates for inflows are “far too high” and for outflows “far too low,” he said. The Cato Institute’s Alex Nowrasteh said the media and researchers “should not support” the study’s findings “based on the quality of the criticisms.” When the Department of Homeland Security published its own most recent estimate on the illegal immigration population in December, it mentioned the Pew Research Center and Center for Migration Studies estimates, but it didn’t cite the Yale study.
How many people are crossing the border illegally?
There’s no official measure of how many people succeed in illegally crossing the border, but authorities use the number of apprehensions to gauge changes in illegal immigration. Apprehensions on the Southwest border peaked in 2000 at 1.64 million and have generally declined since, totaling 396,579 in 2018.
Those numbers, which come from the U.S. Customs and Border Protection, are for fiscal years and date back to 1960.
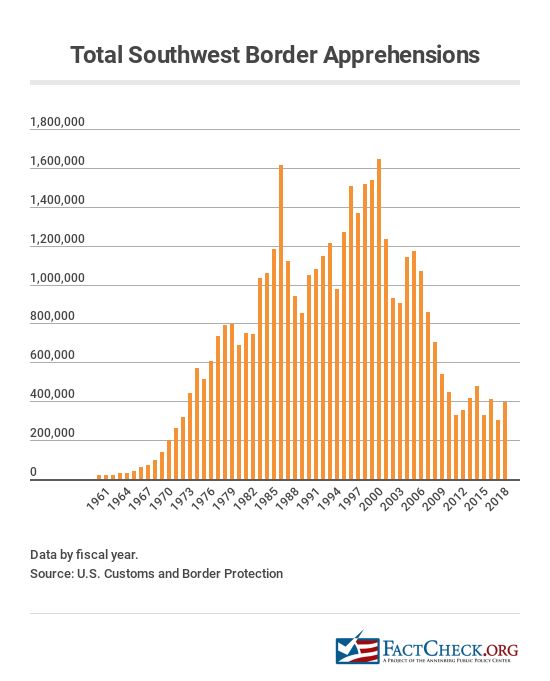
That’s a 76 percent decline in the number of apprehensions between the peak in 2000 and 2018.
We can also look at how the figures have changed over the past several years.
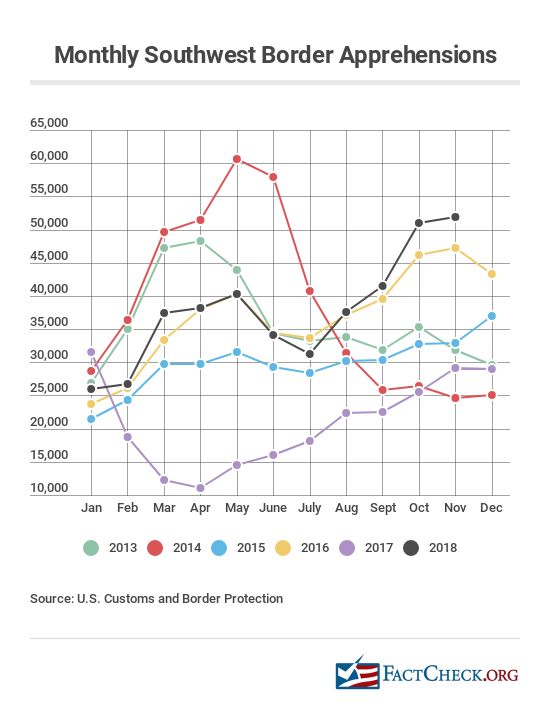
Under the Obama administration, the yearly apprehensions on the Southwest border declined by 35 percent from calendar year 2008, the year before President Obama took office, through the end of 2016. In President Donald Trump’s first full year in office, the apprehensions declined by 43 percent, from calendar year 2016 to 2017.
On a monthly basis, the apprehensions decreased significantly during the first six months of Trump’s tenure and then began to rise. The number was actually higher in November (the most recent month for which the U.S. Customs and Border Protection has published figures) than it was when Trump was sworn in.
What about people overstaying their visas?
As border apprehensions have declined, estimates show a growing proportion of the undocumented population legally entered the country on visas but overstayed the time limits on those visas. A Center for Migration Studies report estimates that 44 percent of those in living in the U.S. illegally in 2015 were visa overstays. That’s up from an estimated 41 percent in 2008.
The CMS report, written by Robert Warren, a former director of the U.S. Immigration and Naturalization Service’s statistics division, says 65 percent of net arrivals — those joining the undocumented population — from 2008 to 2015 were visa overstays.
There are no solid, long-term estimates of the visa overstay problem. When we wrote about this issue in August 2015, DHS told us it didn’t have statistics on visa overstays. But DHS has since issued some estimates. It said that about 629,000 people on visas who were expected to leave in fiscal year 2016 hadn’t done so by the end of that fiscal year (that’s out of 50.4 million arrivals).
That number, however, had declined to about 545,000 by January 2017, DHS said, noting that it expected the estimate to “shift over time as additional information is reported.” CMS disputed the DHS estimate, finding that the number was too high.
For fiscal year 2017, DHS estimated in a report released in August that there were 606,926 suspected in-country overstays, a rate of 1.15 percent of expected departures.
What about families trying to cross the border illegally?
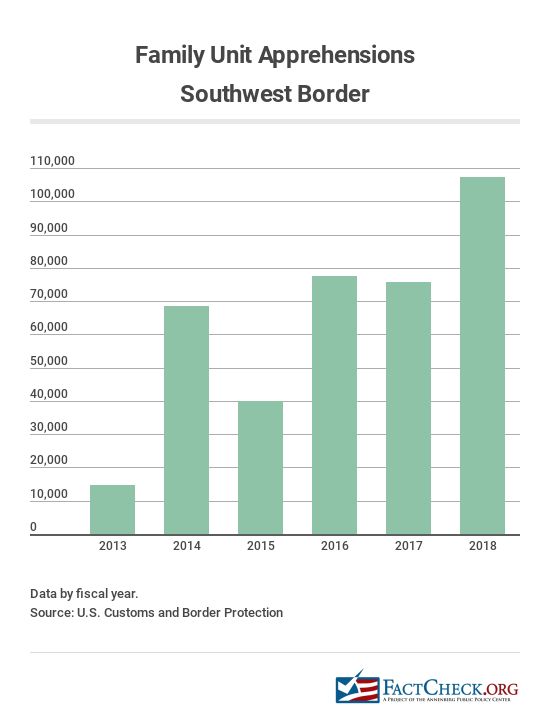
The number of family units apprehended has increased since fiscal year 2013, the first year for which we have such data. While 3.6 percent of those apprehended in 2013 were in a family unit, the proportion was 27 percent in 2018.
In fiscal year 2013, according to Customs and Border Protection data, there were 14,855 people apprehended on the Southwest border who were part of a “family unit” — those are individuals, including children under 18, parents or legal guardians, apprehended with a family member.
The number increased significantly in fiscal year 2014 to 68,445. Then, it dropped the following year to 39,838, before increasing again in fiscal year 2016 to 77,674. The figure was similar in 2017, and it went up in 2018, to 107,212.
We asked Customs and Border Protection if it could provide family unit figures for years prior to 2013. We have not received a response.
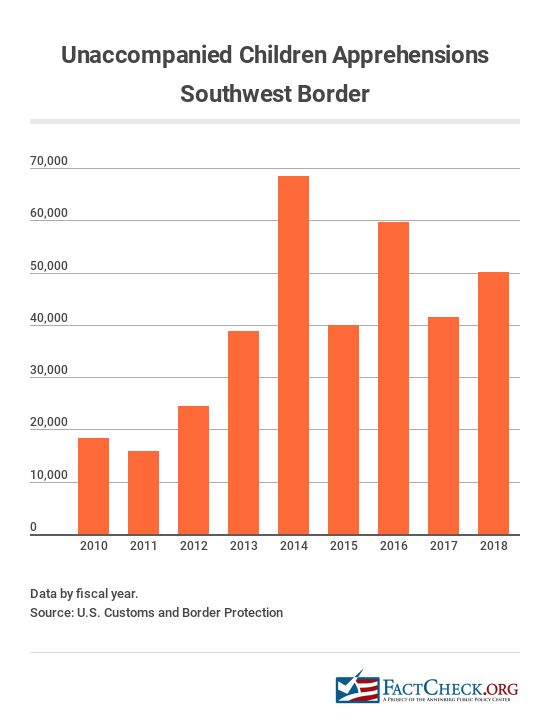
How many unaccompanied children are caught trying to cross the border?
Using the same time period that we have for family units, the number of children under age 18 apprehended crossing the border without a parent or legal guardian was about the same in fiscal year 2013 as it was in 2017 — around 40,000. But it fluctuated in the years in between. In fiscal 2018, the number was 50,036.
In 2014, the Obama administration dealt with a surge of unaccompanied minors on the Southwest border, largely due to those fleeing violence and poverty in the “northern triangle” of Guatemala, Honduras and El Salvador and false rumors about “permits” being issued, as we explained at the time. The number of apprehended unaccompanied children rose from 38,759 in fiscal year 2013 to 68,541 in fiscal year 2014. It went back down to just under 40,000 the following year.
CBP data for unaccompanied children go back further than the available statistics on family units. In fiscal year 2010, the number of unaccompanied children apprehended was 18,411.
How many unaccompanied children, including children separated from their parents, are being held in shelters in the U.S.?
Unaccompanied children are referred to the Department of Health and Human Services’ Office of Refugee Resettlement. HHS said during a conference call on June 26 that there were 11,800 children in ORR shelters, with 2,047 of those being children who had been separated from their parents. The rest — about 83 percent — had crossed the border without a parent or legal guardian.
By early July, HHS Secretary Alex Azar said his agency would reunite nearly 3,000 children who had been separated from their parents.
According to a Dec. 12 court filing in a case brought by the American Civil Liberties Union, there were 131 children still in custody separated from their parents; however, in more than 90 percent of those cases either the parents have indicated they won’t reunify with their children or officials have found the parents are unfit.
DHS and HHS have not provided any figures on how many children were separated from their parents in prior years.
The ORR program houses the children in about 100 shelters in 14 states. In May, an HHS official told Congress that children had spent an average of 57 days in such shelters in fiscal 2018 before being placed with a sponsor, who could be a parent, another relative or a non-family member.
About 80 percent or more of the unaccompanied children referred to HHS over the last several years have been age 13 and older, according to HHS statistics, and about 90 percent or more have been from Honduras, Guatemala and El Salvador.
Is there recidivism?
Yes. Customs and Border Patrol says 10 percent of those apprehended in fiscal year 2017 were caught more than once that year. In 2016, the figure was 12 percent.
How many border patrol agents are there?
In fiscal year 2017, there were 19,437 border patrol agents. The number peaked in fiscal year 2011 at 21,444, so it has declined a bit since then. But the number of agents is still much larger than it was about two decades ago.
The vast majority of agents are assigned to the Southwest border. Back in fiscal year 2000, when apprehensions peaked at 1.64 million, there were 8,580 agents assigned to the border with Mexico. In 2017, when apprehensions were 303,916, there were 16,605 Southwest border agents.
How many people are deported each year?
The Department of Homeland Security says 340,056 people were removed from the U.S. in fiscal 2016. A “removal” is “the compulsory and confirmed movement of an inadmissible or deportable alien out of the United States based on an order of removal.” (See Table 39 of the 2016 Yearbook of Immigration Statistics.)
There are also “returns,” which are “inadmissible or deportable” immigrants who leave voluntarily before a formal removal order is issued. Returns totaled 106,167 that year.
The peak for combined removals and returns was 1.86 million in fiscal 2000 — the same year that apprehensions on the Southwest border also peaked. In fact, the bar graph of these statistics mirrors the graph on apprehensions (see above) — generally, when apprehensions were higher, so, too, were removals and returns.
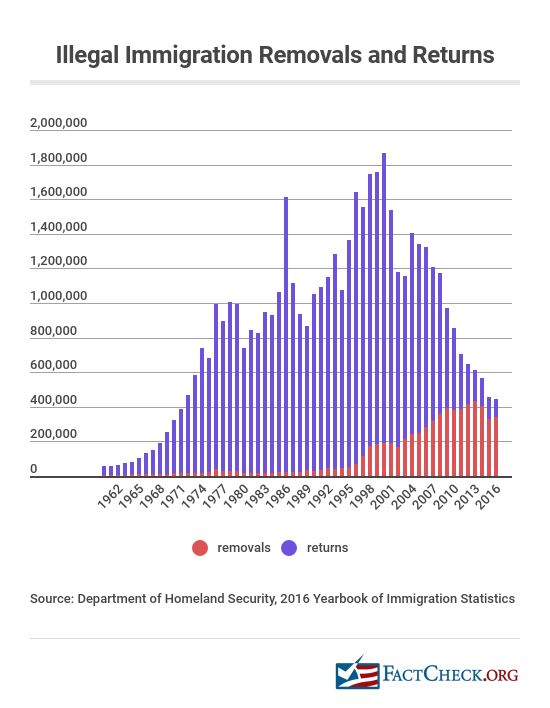
Since fiscal 2011, removals have been higher each year than returns. Before that, the reverse was true.