Summary
With the economy on the top of voters’ minds this election year, we take a look at some key statistical measures of how the U.S. has performed under President Joe Biden:
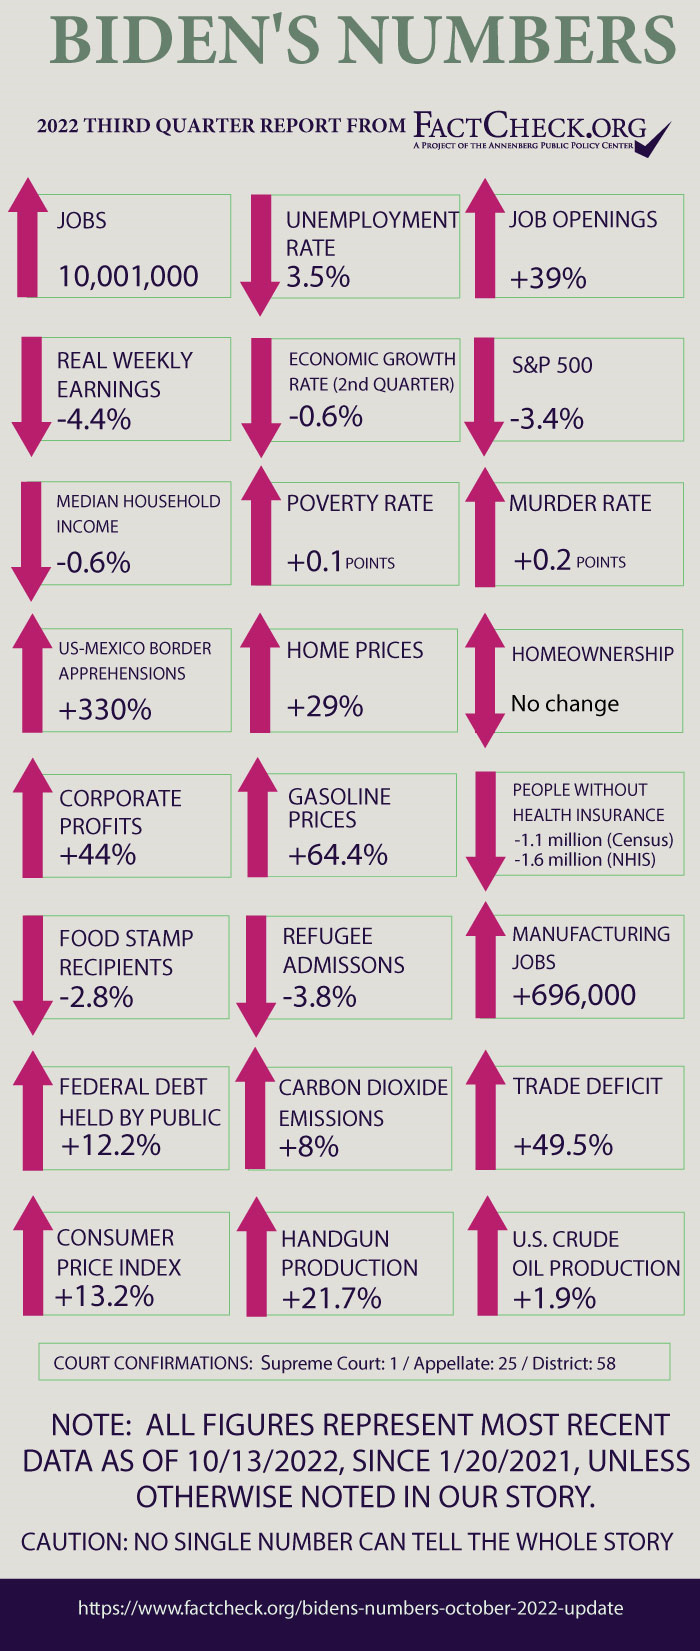
- The economy gained 10 million jobs; total employment is now half a million higher than before the pandemic.
- Unemployment fell to 3.5%; unfilled job openings surged, with 1.7 slots for every person seeking work.
- Inflation roared back to the highest level in over 40 years. Consumer prices are up 13.2%. Gasoline alone rose 64%.
- Wages rose briskly, by 9%. But after adjusting for inflation, “real” weekly earnings went down 4.4%.
- The economy contracted for two consecutive quarters this year, but after-tax corporate profits set new records.
- Apprehensions of those trying to enter the country illegally through the southwest border are up 330% for the past 12 months, compared with President Donald Trump’s last year in office.
- The trade deficit continues to expand and could be headed for a record $1 trillion by year’s end.
- Household income has gone down slightly.
- The number of people receiving food benefits through the Supplemental Nutrition Assistance Program has continued to decline and is now 2.8% lower.
- The number of those without health insurance went down by 1.1 million.
- The murder rate went up by 0.2 percentage points, though the FBI relied on less data than normal to make the estimate.
- Home prices are up 29%, but the homeownership rate remains unchanged.
- The administration accepted only 25,465 refugees in fiscal year 2022 that just ended — far fewer than the president’s goal of 125,000.
Analysis
President Joe Biden has been in office for nearly two years, during which time he enacted major pieces of legislation such as the American Rescue Plan Act, the Infrastructure Investment and Jobs Act and the Inflation Reduction Act. He also has been navigating crises both here and abroad, from a surge of migrants at the U.S. southern border to Russia’s war against Ukraine.
Here we provide the best available data to measure how the U.S. has been performing under the Democratic president as voters head to the polls for the midterm elections.
For this report, we have newly released Census Bureau figures on poverty, household income and health insurance, an FBI report on nationwide crime, and handgun production data from the Bureau of Alcohol, Tobacco, Firearms and Explosives, among other things.
As always, we make no judgment as to how much credit or blame any president deserves for changes that happen during his time in office. We leave that for others to decide.
Jobs and Unemployment
The number of people with jobs has increased dramatically since Biden took office, finally surpassing pre-pandemic levels.
Employment — The U.S. economy added 10,001,000 jobs between Biden’s inauguration and September, the latest month for which data are available from the Bureau of Labor Statistics. As of September, 514,000 more people had jobs than in February 2020, the peak of employment before COVID-19 forced massive shutdowns and layoffs.
One major category of jobs is still lagging, however. Government employment is still 597,000 jobs short of the pre-pandemic peak — including 309,000 public school teachers and other local education workers.
Unemployment — The unemployment rate fell from 6.4% at the time Biden took office to 3.5% in September — a decline of 2.9 percentage points. The current rate is exactly where it was in the months just before the pandemic.
Since 1948, when BLS began keeping records, the jobless rate has been at or below 3.5% for only 58 months, or 6.5% of the time. Three of those months were during the Trump years, including when the rate hit a low of 3.5% in January and February 2020, just before the pandemic. That was the lowest since the 1960s.
Job Openings — The number of unfilled job openings soared to a record of nearly 11.9 million during Biden’s first 14 months in office, but then declined somewhat.
The number had slipped down to just 10 million on the last business day of August, the most recent month on record. That’s still an increase of just over 2.8 million openings — or 39% — during Biden’s time.
In August, there was an average of nearly 1.7 jobs for every job seeker. When Biden took office, there were more job seekers than openings.
The number of job openings in September is set to be released Nov. 1.
Labor Force Participation — One reason many job openings go unfilled is that millions of Americans left the workforce during the pandemic and haven’t returned. The labor force participation rate (the percentage of the total population over age 16 that is either employed or actively seeking work) has inched up slightly during Biden’s time, from 61.4% in January 2021 to 62.3% in September.
That’s an increase of only 0.9 percentage points, and still leaves the rate well below the pre-pandemic level of 63.4% for February 2020.
The rate peaked at 67.3% during the first four months of 2000, and even before the pandemic economists predicted further declines due largely to the aging population. The most recent 10-year economic projection by the nonpartisan Congressional Budget Office predicts the rate will rise only to 62.4% by the middle of next year — still well below the pre-pandemic level — then resume its long-term slide and drop to 61.4% by the end of 2032.
Manufacturing Jobs — During the presidential campaign, Biden promised he had a plan to create a million new manufacturing jobs — and whether it’s his doing or not, the number is rising briskly.
As of September, the U.S. added 696,000 manufacturing jobs during Biden’s time, a 5.7% increase in the space of 20 months, according to BLS. Furthermore, the September total is 95,000 above the number of manufacturing jobs in February 2020, before the pandemic forced plant closures and layoffs.
During Trump’s four years, the economy lost 182,000 manufacturing jobs, or 1.4%, largely due to the pandemic.
Wages and Inflation
CPI — Inflation came roaring back under Biden — with prices rising faster than they have in over 40 years.
During his first 20 months in office, the Consumer Price Index rose 13.2%.
It’s the worst inflation in decades. The 12 months ending in June saw a 9.1% increase in the CPI (before seasonal adjustment), which the Bureau of Labor Statistics said was the biggest such increase since the 12 months ending in November 1981. And the rise during the most recent 12 months, ending in September, was only slightly less — 8.2%
The current inflation is hitting especially hard where people experience it most regularly — at the gas pump and at the grocery store. In the most recent 12 months, gasoline prices increased 18.2% and food at home increased 13%, the BLS said.
And with winter weather approaching, the cost of home heating is going up at an alarming rate. BLS said the 12-month rise in household energy costs — a mix including electricity, piped gas, propane and home heating oil — was 20.8% as of September.
Gasoline Prices — The price of gasoline has gyrated wildly under Biden.
During the first 57 weeks of his administration, the national average price of regular gasoline at the pump rose briskly by $1.15 (or 48.4%) as motorists resumed travel and the economy bounced back after pandemic lockdowns.
Then, in the first 16 weeks following Russia’s invasion of Ukraine on Feb. 24, the price shot up by another $1.48 per gallon as world oil markets were disrupted by the West’s efforts to punish Russia, the world’s third largest oil producer (after the U.S. and Saudi Arabia). Gasoline prices reached a record high of just over $5 per gallon in the week ending June 13.
After that the price dropped steadily for 14 weeks, to $3.65 in the week ending Sept. 19, a decline of $1.35 below the record high.
But in the past few weeks the price has again turned up, reaching $3.91 per gallon in the week ending Oct. 10.
So after all the ups and downs (mostly ups), the most recent price is $1.53 higher than in the week before Biden took office, an increase of 64.4%
Prices are not expected to ease much from there. In its most recent Short-Term Energy Outlook, the U.S. Energy Information Administration predicted that gasoline prices would average $3.57 during 2023.
Wages — Wages also have gone up under Biden, but not as fast as prices.
Average weekly earnings for rank-and-file workers went up 9% during Biden’s first 20 months in office, according to monthly figures compiled by the BLS. Those production and nonsupervisory workers make up 81% of all employees in the private sector.
But inflation ate up all that gain and more. What are called “real” weekly earnings, adjusted for inflation and measured in dollars valued at their average level in 1982-84, actually declined 4.4% during that time.
Since our last report, however, wage gains have started to outpace inflation. Real weekly earnings rose 1% between June and September.
Economic Growth
The U.S. economy contracted for the second straight quarter this year, triggering concerns of a pending recession. But the string of down quarters is expected to soon end.
The real gross domestic product, which accounts for inflation, declined at an estimated annual rate of 1.6% in the first quarter of this year and 0.6% in the second quarter, according to the Bureau of Economic Analysis. The back-to-back down quarters followed a 5.9% increase in real GDP in Biden’s first year.
The National Bureau of Economic Research’s Business-Cycle Dating Committee is a nonpartisan group that officially declares the start and end of a recession, and it says that most, not all, past recessions were marked by “two or more consecutive quarters of declining real GDP.” But the committee considers many other factors when declaring a recession, which it generally defines as “a significant decline in economic activity that is spread across the economy and that lasts more than a few months.”
In addition to real GDP, the committee bases its decision on a range of monthly economic indicators, including inflation, which remained stubbornly high in September, consumer spending, which went up in August, and nonfarm payroll employment, which rose in September and has increased every month so far under Biden.
The first official estimate for the third quarter of 2022 won’t be released until Oct. 27. But the Federal Reserve Bank of Atlanta’s “GDP Now” estimated on Oct. 7 that the economy will grow by 2.9% in the third quarter.
In May, the nonpartisan Congressional Budget Office projected the economy would expand by 3.1% in 2022. The most recent forecast of the Federal Reserve Board members and Federal Reserve Bank presidents, issued in June, produced a median estimate of a 1.7% real GDP growth (Table 1) for both 2022 and 2023.
Even so, there’s still plenty of talk of a global recession happening next year.
“Economic growth is projected to resume in the second half of 2022, but the combination of high inflation, monetary policy tightening, and a slowing housing market is likely to tip the economy into a modest recession in the new year,” Fannie Mae, the government-sponsored mortgage finance giant, said in a Sept. 21 press release.
The World Bank says there’s a risk of a global recession next year.
“Global growth is slowing sharply, with further slowing likely as more countries fall into recession,” World Bank Group President David Malpass said in a Sept. 15 statement. “My deep concern is that these trends will persist, with long-lasting consequences that are devastating for people in emerging market and developing economies.”
Correction, Oct. 17: Our story originally said that the National Bureau of Economic Research was a “government entity.” It is not. It’s a private, nonpartisan organization. We have corrected the story.
Crime
The FBI estimated that “violent and property crime remained consistent between 2020 and 2021.” Specifically, the number of violent crimes went down by an estimated 1%; the number of murders went up by 4.3%; robberies went down by 8.2%. But the figures “are not considered statistically significant,” the FBI said, which is why “the overall message is that crime remained consistent.”
The estimates also come with increased uncertainty, as we’ve explained before.
The FBI’s Uniform Crime Reporting Program is a voluntary reporting program. It has been transitioning to a new system for local law enforcement agencies to submit data, and as of Jan. 1, 2021, agencies were required to use what’s called the National Incident-Based Reporting System. But many, including police departments in New York City and Los Angeles, haven’t made the switch to NIBRS and aren’t included in the raw 2021 statistics.
So, the FBI and the Bureau of Justice Statistics have provided national estimates, based on data for 66% of the U.S. population. In the past, the FBI said, annual figures accounted for 90% or more of the population.
In an Oct. 5 press release on the 2021 statistics, the FBI explains, “Together, the FBI and BJS developed and tested statistical procedures that assess the quality and completeness of NIBRS data, created methods to adjust for non-transitioned agencies, crafted estimation procedures for generating reliable and accurate national indicators as new agencies report NIBRS data, and established a semi-automated system for producing national estimates of key crime indicators on an annual basis.”
The estimated 4.3% increase in the number of murders is significantly lower than the 29.4% increase from 2019 to 2020, before Biden took office. The estimated murder rate in 2021 was 6.9 per 100,000 population, a 0.2 percentage point increase from the 6.7 rate in 2020.
The number and rate of rapes went up (by 1.2 percentage points for the rate), while aggravated assaults went down (by 2.3 percentage points for the rate). The FBI said the overall drop in violent crime was “driven mainly” by the estimated decline in robberies.
The estimated number of property crimes declined by 3.8%.
Given the FBI had to do more estimating than normal, we also looked at other sources for information on large cities.
The Major Cities Chiefs Association, which collects statistics from law enforcement agencies in big cities, found that homicides went up by 6.2% from 2020 to 2021, but its latest report shows a decline of 2.4%, comparing the first six months of 2022 to the same period in 2021. The data is from 70 law enforcement agencies.
Similarly, the nonpartisan think tank Council on Criminal Justice found a 5% increase in the number of homicides from 2020 to 2021 in 22 U.S. cities, but its latest report shows a 2% decline for the first six months of 2022, compared with the same time period in 2021 in 23 cities. However, “the homicide rate remains 39% above the level prior to the COVID-19 pandemic (in the first half of 2019),” the authors note.
Another analysis, by AH Datalytics, using publicly available information from 90 larger law enforcement agencies nationwide, shows a 5.3% drop in murders so far in 2022, as of data compiled by Oct. 13, compared with 2021. The organization is run by criminal justice data analysts.
Trade
The Bureau of Economic Analysis’ most recent figures show that the U.S. imported almost $977.4 billion more in goods and services than it exported during the most recent 12 months ending in August. The international trade deficit was $323.4 billion, or about 49%, higher than in 2020. The trade gap grew more than 36% under Trump.
Through the first eight months of 2022, the U.S. imported a monthly average of $84.3 billion more in goods and services than it exported. If imports continue to exceed exports at that rate, the annual trade deficit for 2022 will exceed $1 trillion for the first time on record.
Health Insurance
The number of people without health insurance has gone down under Biden. The decrease was 1.1 million people from 2020 to 2021, according to the Census Bureau’s latest annual report.
In 2020, the year before Biden took office, 28.3 million people, or 8.6% of the population, lacked health insurance for the entire year. Those figures dropped to 27.2 million, or 8.3%, in 2021. The Census report was published in September.
As has been the case for many years, most of the population had employer-based insurance coverage in 2021. Altogether, 66% of the population had private insurance, which includes work-based plans, direct purchases, Tricare (insurance for military members and their families), and Affordable Care Act marketplace plans.
Public, or government-sponsored plans, enrolled 35.7% of the population, split nearly evenly between Medicare and Medicaid, with a small percentage (1%) on Veterans Affairs plans.
The National Health Interview Survey, which measures the number of uninsured at the time people were interviewed — as opposed to being uninsured for the entire year — found a decrease in the number of uninsured people of 1.6 million from 2020 to 2021.
Early release figures from the NHIS show those lacking health insurance declined further in the first quarter of 2022. The estimates are that 8% of the population was uninsured in the first quarter, down from 8.8% in the fourth quarter of 2021.
The chart below shows how the number of uninsured people has changed since 2016, according to the Census figures. Technical note: Due to changes in survey methods, Census says the 2018 and later figures should be compared with the 2016 and 2017 numbers from a research and bridge file.
Income and Poverty
Household Income — Household income continued to decline in Biden’s first year.
In 2021, the Census Bureau’s measure of real median household income was $70,784, a decrease of $402, or 0.6%, from 2020. That was the second consecutive annual decrease, after median household income, when adjusted for inflation, declined $1,622 during the first year of the pandemic.
(The median figure represents the midpoint — half of all households earned more, half less.)
Prior to 2020, the real median income figure had reached a record of $72,808 in 2019, which was about $6,150 more than in 2016 – the year before Trump took office.
Poverty — As incomes declined, the rate of poverty rose slightly.
The percentage of Americans living with income below the official poverty line went up 0.1 percentage points – from 11.5% of the population in 2020 to 11.6% in 2021.
That was the second straight year that the poverty rate increased. Before COVID-19, the rate declined five years in a row.
The Census Bureau lists the official poverty rate in 2019 as 10.5% — seemingly the lowest rate going back to 1959, which is as far back as Census data go. But the bureau has said that the 2019 rate was probably more than half a percentage point higher than that due to lower than normal survey response rates from low-income individuals during the pandemic.
“With the nonresponse bias correction, we estimate a poverty rate of 11.1 percent in 2019, compared to the official estimate of 10.5 percent,” Census said in a September 2020 report. That would tie the 11.1% poverty rate in 1973 as the lowest on record.
In raw numbers, there were about 37.9 million people below the poverty line in 2021. That was roughly 385,000 more than in 2020, according to the Census’ latest estimates.
The official poverty rate, however, does not include government programs that benefit low-income families and individuals — such as housing and food assistance — that were expanded in COVID-19 relief bills that became law under Trump and Biden. The Census Bureau measures the impact of these programs using the Supplemental Poverty Measure, which it began publishing in 2011.
The supplemental poverty rate declined last year, from 9.2% in 2020 to 7.8% in 2021 — “the lowest SPM poverty rate since estimates were first published and the third consecutive decline,” Census said in its Sept. 18 report.
Children experienced the steepest drop in supplemental poverty, according to the bureau’s analysis. The SPM rate for kids declined to 5.2% in 2021, the lowest level on record and down 4.5 percentage points from the 2020 rate of 9.7%.
“The decline in the SPM rate for children was largely driven by stimulus payments and the refundable Child Tax Credit, which led to increased resources for families with children,” the report said.
Biden repeatedly has touted this drop in childhood poverty. For instance, his proclamation on Child Health Day on Sept. 30, said: “To give hardworking parents more breathing room during the pandemic, I expanded the child tax credit — a measure estimated to have helped cut child poverty by over 40 percent last year.”
But the expanded credit expired at the end of 2021.
Food Stamps
The number of people in the Supplemental Nutrition Assistance Program, formerly known as food stamps, has declined, again, since our last update.
As of June, nearly 41 million people — 40,986,375 — were receiving food assistance. That’s about 240,000 fewer people than in April, and it’s a decline of 2.8%, or nearly 1.2 million people, from January 2021 when Biden became president. The figures come from the Department of Agriculture’s latest data.
The SNAP enrollment under Trump was as low as 36.9 million in February 2020. But that changed during the coronavirus pandemic.
Under Biden, enrollment was a bit lower than the June figure at 40.8 million in August and September 2021.
Border Security
The number of apprehensions of people trying to enter the U.S. illegally at the southwest border has stabilized in recent months, but remains near historic highs.
To even out the seasonal changes in border crossings, our measure compares the most recent 12 months on record with the year prior to a president taking office. And for the past 12 months ending in August, the latest figures available, apprehensions totaled 2,183,284, according to U.S. Customs and Border Protection. That’s 330% higher than during Trump’s last year in office.
As we have noted in past editions of “Biden’s Numbers,” apprehensions were on the rise when Trump left office — and were 14.7% higher in Trump’s last year compared with the year before he took office. But the number of apprehensions jumped dramatically and has remained high since Biden became president.
Since our last report in July, apprehensions stabilized in July and August, when there were 181,765 and 181,160 apprehensions, respectively. That’s about 19% lower than the 224,397 apprehensions in May, which represented a high for the Biden administration and were more than in any single month going back to at least fiscal year 2000. But the July and August numbers are still at about the monthly average for the fiscal year.
A significant demographic shift in the nationality of migrants coming across the border between ports of entry explains some of the dramatic increase in apprehensions. Specifically, there has been a jump in the number of migrants coming this year from Cuba, Nicaragua and Venezuela, authoritarian-run countries with which the U.S. has strained diplomatic relations, Ariel Ruiz Soto, a policy analyst for the Migration Policy Institute, explained to us in a phone interview.
In the spring and early summer, there was a dramatic increase in the number of Cuban migrants, including 35,000 in April alone, as many Cubans sought to flee the country’s economic crisis and a crackdown on political dissidents. And when Nicaragua lifted the tourist visa requirement for Cubans in November 2021, it made it easier for Cubans to fly to Nicaragua and then head to the U.S. border via a land route. The number of Cuban migrants declined in the summer months, largely in response to migration management policies implemented after the Summit of the Americas in June, Ruiz Soto said.
But just as the number of Cuban migrants began to decline, there was a sharp increase in the number of Venezuelans coming across the U.S. border, Ruiz Soto said.
More than 80% of Mexican migrants apprehended at the border are simply turned around under Title 42, a public health law invoked in response to the pandemic in March 2020 that allowed border officials to immediately return many of those caught trying to enter the country illegally.
But due to diplomatic tensions, there are barriers to repatriating migrants from Cuba, Nicaragua and Venezuela. That also acts as a magnet, Ruiz Soto said, as migrants from those countries know there is little chance they will be returned to their home country, and instead they will be released into the U.S. pending asylum or other immigration hearings. In August, he said, there were more apprehensions of migrants from Cuba, Venezuela and Nicaragua than from El Salvador, Honduras and Guatemala — bucking the traditional flow of immigration to the U.S.
On Sept. 20, Biden referenced this shift when he said the border challenge is now, “a totally different circumstance. What’s on my watch now is Venezuela, Cuba and Nicaragua. And the ability to send them back to those states is not rational.”
The higher number of apprehensions at the border doesn’t necessarily reflect a lack of order or control at the border — or an “open border” as some Republicans put it — but rather is a function of migrants adapting to regulations and U.S. policy, Ruiz Soto said. Many of those from Cuba, Nicaragua and Venezuela don’t really even try to evade authorities, and in many cases seek them out once they have crossed the border, Ruiz Soto said, because they know they are likely to be processed and then released in the country pending an immigration hearing.
For Mexicans, Ruiz Soto said, the Title 42 policy has had another unintended consequence: It has encouraged migrants to make multiple attempts to cross the border, because if caught they are simply returned to Mexico without any further repercussions. According to U.S. Customs and Border Protection, the recidivism rate — meaning the share of people caught crossing more than once in a fiscal year — was 27% in fiscal year 2021, far higher than in pre-Title 42 years. (The recidivism rate was 7% in fiscal year 2019.)
Although the Biden administration sought to terminate Title 42, a federal judge in May blocked that, and the policy has remained in place pending appeals. Should Title 42 go away, Ruiz Soto said the number of migrants attempting to illegally cross the border is likely to increase “but not as much as people think” because under previous policy, migrants caught attempting to cross illegally could face having a formal removal order placed on their record, or criminal prosecution.
Corporate Profits
As inflation rises, corporate profits keep setting records.
After-tax corporate profits reached a record high of $2.75 trillion last year — and they topped that mark in both the first and second quarters of this year at annual rates, according to the BEA. (See line 45.)
The 2021 profits were 30% higher than the full-year figure for 2020, as estimated by the BEA.
The BEA’s estimate for the second quarter shows after-tax profits running at an annual rate of more than $3 trillion — a 44% increase over the full-year 2020 figure.
Stock Markets
Stock market gains that were made in Biden’s first year have been wiped out in 2022.
Under the past two presidents, the stock markets went steadily up. The S&P 500 index rose 166% over the eight years Obama was in office, and it climbed another 67.8% during Trump’s four years.
But since Biden took office, the S&P 500 is down 3.4% at the close of the market on Oct. 13. For the year, it’s down 23%.
The Dow Jones Industrial Average, which is made up of 30 large corporations, is down 2.9% since Biden took office. For the year, the Dow dropped 17.3%.
The Dow rallied on Oct. 13 to close more than 800 points higher and finish above 30,000. It dropped below 30,000 on June 16 for the first time since Jan. 4, 2021, and has been struggling to stay above that line this fall.
The NASDAQ composite index, made up of more than 3,000 companies, including many in the technology sector, has been hit the hardest — saddled by tech stocks that have been performing particularly poorly. The NASDAQ is down 19.3% since Biden took office and a staggering 31.9% so far this year.
High yields on U.S. Treasury notes and a strong U.S. dollar have hurt big tech, Jack Ablin, chief investment officer at Cresset Capital, told CNBC in September. “This is a one-two punch on tech,” Ablin said. “The strong dollar doesn’t help tech. High 10-year Treasury yields don’t help tech.”
Back on July 19, 2021, Biden deflected questions about inflation and boasted about a strong stock market, telling reporters “the stock market is higher than it has been in all of history.”
Last month, the president reminded reporters that “the stock market doesn’t necessarily reflect the state of the economy, as you well know.”
“And the economy is still strong,” Biden added. “Unemployment is low. Jobs are up. Manufacturing is good. So I think it’s — I think we’re going to be fine.”
Consumer Sentiment
Inflation has taken its toll on consumer confidence in the economy under Biden.
The University of Michigan’s Surveys of Consumers reported that its monthly Index of Consumer Sentiment for September was 58.6. That’s slightly better than our last report – when the index dropped to a low of 50 in June. But it’s still 20.4 points lower than it was when Biden took office in January 2021.
Joanne W. Hsu, director and chief economist of the Surveys of Consumers, attributed the decline to concerns about inflation, which she said extend to all income levels.
The “sentiment for consumers across the income distribution has declined in a remarkably close fashion for the last 6 months, reflecting shared concerns over the impact of inflation, even among higher-income consumers who have historically generated the lion’s share of spending,” Hsu said in a statement on the final survey results for September.
Home Prices & Homeownership
Home Prices — With interest rates continuing to climb, the red-hot housing market has begun to cool off.
The median price of an existing, single-family home sold was $396,300 in August — down from a record high of $420,900 in June, according to the National Association of Realtors. It was the second straight month that the median home price fell.
“The housing sector is the most sensitive to and experiences the most immediate impacts from the Federal Reserve’s interest rate policy changes,” NAR Chief Economist Lawrence Yun said in a Sept. 21 press release.
The 30-year fixed-rate mortgage averaged 6.66% as of Oct. 6 – more than double the 2.99% rate a year ago, according to mortgage buyer Freddie Mac.
Nevertheless, home prices are up 29% since Biden took office in January 2021, when the median price of an existing, single-family home sold was $308,000.
Homeownership — High home prices and low inventory – and now higher interest rates – have kept homeownership rates virtually unchanged under Biden.
The homeownership rate, which the Census Bureau measures as the percentage of occupied housing units that are owner-occupied, was 65.8% in the second quarter of 2022 — identical to the rate during Trump’s last quarter in office. (Usual word of caution: The bureau warns against making comparisons with the fourth quarter of 2020, because of pandemic-related restrictions on in-person data collection.)
The rate peaked under Trump in the second quarter of 2020 at 67.9%. The highest homeownership rate on record was 69.2% in 2004, when George W. Bush was president.
Refugees
Biden continues to fall way short of his campaign promise to accept up to 125,000 refugees into the United States each year.
On Sept. 27, the Biden administration set the cap on refugee admissions for fiscal year 2023 at 125,000 – just as it did in fiscal year 2022.
But in fiscal year 2022, the administration accepted only 25,465 refugees, according to the State Department.
Overall, the U.S. has admitted 35,473 refugees in Biden’s first full 20 months in office, or 1,774 per month, the data show. That’s nearly 4% less than the 1,845 monthly average during Trump’s four years. (For both presidents, our monthly averages include only full months in office, excluding the month of January 2017 and January 2021, when administrations overlapped.)
In setting the admissions cap at 125,000 for fiscal year 2022, the State Department all but acknowledged it would fall short of that goal, telling Congress that the COVID-19 pandemic “will undoubtedly impact” the administration’s ability “to process large numbers of refugees safely” in fiscal year 2022. The department also said that it needed to rebuild its staff after four years of cuts by the Trump administration.
This year, in its report to Congress for fiscal year 2023, the State Department said “we are beginning to make progress towards fulfilling President Biden’s ambitious admissions target.”
That progress was evident in September, when the U.S. admitted more than 5,500 refugees — the highest monthly amount since January 2017. But the Biden administration would need to average nearly twice that amount in order to meet the president’s goal of admitting 125,000 refugees in fiscal year 2023.
Guns
Handgun production — In 2021, annual production of pistols and revolvers in the U.S. totaled just over 7.9 million, according to preliminary figures from the Bureau of Alcohol, Tobacco, Firearms and Explosives released on July 18.
That represented an increase of about 21.7% from 2020, when handgun production during the beginning of the pandemic surged to a then-record of over 6.5 million.
Prior to 2020, handgun production had gone down by more than a third under Trump through 2019. That was after production more than tripled during President Barack Obama’s time in office.
Gun sales — Gun purchases slid again during the third quarter of 2022, according to the most recent estimates from the National Shooting Sports Foundation.
Since the federal government doesn’t collect data on gun sales, the NSSF, a gun industry trade group, estimates gun sales by tracking the number of background checks for firearm sales based on the FBI’s National Instant Criminal Background Check System, or NICS. The NSSF-adjusted figures exclude background checks unrelated to sales, such as those required for concealed-carry permits.
The group reported that the NSSF-adjusted NICS total for background checks during the third quarter was 3.76 million, which is a decrease of 5.2% from the 3.97 million in the third quarter of 2021. Also, it’s down more than 33% from the 5.63 million during Trump’s final full quarter as president.
Through the first nine months of 2022, there were 11.89 million background checks for firearm sales. That was roughly 27% less than the 16.24 million in the last nine months of 2020, which was a record year for sales, according to NSSF estimates.
Judiciary Appointments
Supreme Court — Biden has won confirmation for one Supreme Court nominee, Justice Ketanji Brown Jackson. At the same point in his term, Trump had won confirmation for two: Justices Neil Gorsuch and Brett Kavanaugh. Justice Jackson replaced retired Justice Stephen G. Breyer, who was appointed by then-President Bill Clinton and served nearly three decades.
Court of Appeals — Twenty-five U.S. Court of Appeals judges have been confirmed under Biden. At the same point in Trump’s presidency, 29 had been confirmed.
District Court — Biden has won confirmation for 58 District Court judges. For Trump, at the same time in his term, 53 nominees had been confirmed.
Two U.S. Court of Federal Claims judges also have been confirmed under Biden.
There were 87 federal court vacancies, with 44 nominees pending, as of Oct. 13.
Oil Production and Imports
U.S. crude oil production averaged roughly 11.54 million barrels per day during Biden’s most recent 12 months in office (ending in July), according to U.S. Energy Information Administration data published in late September. That was over 1.9% higher than the average daily amount of crude oil produced in 2020.
In its Short-Term Energy Outlook for October, the EIA projected that crude oil production would average 11.7 million barrels per day in 2022, which would be more than every year but 2019.
U.S. crude oil imports in Biden’s last 12 months averaged more than 6.3 million barrels per day — up more than 7.4% from imports in 2020.
Carbon Emissions
U.S. carbon emissions increased slightly since our last quarterly update.
In the most recent 12 months on record (ending in June), there were almost 4.95 billion metric tons of emissions from the consumption of coal, natural gas and various petroleum products, according to the EIA’s latest estimates. That’s up over 8% from the almost 4.58 billion metric tons that were emitted in 2020 — but still lower than the almost 5.15 billion metric tons emitted in 2019.
The EIA has said the increase, which began in 2021, “followed a rise in economic activity and energy consumption once the initial economic impacts of the COVID-19 pandemic began to subside.”
The EIA currently projects that energy-related CO2 emissions will increase by 1.5% this year and then “decrease 2.3% in 2023 to just under 2021 levels.”
Debts and Deficits
Debt — Since our last update in July, the public debt, which excludes money the government owes itself, increased by more than $395 billion to $24.28 trillion, as of Oct. 12. That total is about 12.2% higher than the debt of nearly $21.64 billion when Biden took office.
Deficits — Meanwhile, the Congressional Budget Office estimates that the federal deficit declined to $1.4 trillion in fiscal year 2022 — down about 50% from $2.8 trillion in fiscal year 2021 and about 55% less than the $3.1 trillion deficit in fiscal year 2020. (The Treasury Department is expected to release the official deficit figure for FY 22 later this month.)
As we wrote earlier this year, most of the reduction in deficits is the result of expiring emergency pandemic spending — not actions taken by Biden, as he has suggested at times. Before any of Biden’s fiscal policies were enacted, CBO projected that, under existing law at the time, the federal budget deficit would be almost $2.3 trillion in 2021 and about $1.1 trillion in 2022.
Editor’s note: FactCheck.org does not accept advertising. We rely on grants and individual donations from people like you. Please consider a donation. Credit card donations may be made through our “Donate” page. If you prefer to give by check, send to: FactCheck.org, Annenberg Public Policy Center, 202 S. 36th St., Philadelphia, PA 19104.
Sources
U.S. Bureau of Labor Statistics. Employment, Hours, and Earnings from the Current Employment Statistics survey (National): Total Nonfarm. Accessed 13 Oct 2022.
U.S. Bureau of Labor Statistics. Labor Force Statistics from the Current Population Survey: Unemployment. Accessed 13 Oct 2022.
U.S. Bureau of Labor Statistics. Job Openings and Labor Turnover Survey: Job Openings. Accessed 13 Oct 2022.
U.S. Bureau of Labor Statistics. Labor Force Statistics from the Current Population Survey: Labor Force Participation Rate. Accessed 13 Oct 2022.
U.S. Bureau of Labor Statistics. The Economics Daily. “Labor force participation rates projected to decline over the next decade.” 1 Nov 2017.
Congressional Budget Office. “The Budget and Economic Outlook: 2022 to 2032.” May 2022.
U.S. Bureau of Labor Statistics. Employment, Hours, and Earnings from the Current Employment Statistics survey (National): Manufacturing. Accessed 13 Oct 2022.
Bureau of Labor Statistics. “Consumer Price Index – All Urban Consumers (Seasonally Adjusted).” Data extracted 13 Oct 2022.
U.S. Bureau of Labor Statistics. Consumer Price Index Summary. News release. 13 Jul 2022.
U.S. Bureau of Labor Statistics. Consumer Price Index Summary. News release. 13 Oct 2022.
U.S. Bureau of Labor Statistics. “Measuring Price Change in the CPI: Household energy.” Fact sheet. 13 Mar 2022.
Bureau of Labor Statistics. “Employment, Hours and Earnings from the Current Employment Statistics survey (National); Average Weekly Earnings of Production and Nonsupervisory Employees, total private.” Data extracted 13 Oct 2022.
Bureau of Labor Statistics. “Employment, Hours and Earnings from the Current Employment Statistics survey (National); Average Weekly Earnings of Production and Nonsupervisory Employees, 1982-1984 dollars, total private.” Data extracted 13 Oct 2022.
U.S. Energy Information Administration. “Weekly U.S. Regular All Formulations Retail Gasoline Prices.” Data extracted 10 Oct 2022.
U.S. Energy Information Administration. “Short Term Energy Outlook October 2022.” 10 Oct 2022.
“FBI Releases 2021 Crime in the Nation Statistics.” Press release. FBI. 5 Oct 2022.
“The Transition to the National Incident-Based Reporting System (NIBRS): A Comparison of 2020 and 2021 NIBRS Estimates.” FBI. 5 Oct 2022.
Gore, D’Angelo et al. “Biden’s Numbers (Second Quarterly Update).” FactCheck.org. 21 Jul 2022.
Bureau of Justice Statistics and FBI. “NIBRS Estimation Summary.” bjs.ojp.gov. Aug 2022.
FBI. “FBI Releases 2020 Crime Statistics.” Press release. FBI.gov. 27 Sep 2021.
Major Cities Chiefs Association. Violent Crime Survey – National Totals. Midyear Comparison January 1 to June 30, 2022, and 2021. 2 Aug 2022.
Rosenfeld, Richard et al. “Pandemic, Social Unrest, and Crime in U.S. Cities: Mid-Year 2022 Update.” Council on Criminal Justice. Jul 2022.
YTD Murder Comparison. AH Datalytics. accessed 12 Oct 2022.
Keisler-Starkey, Katherine and Lisa N. Bunch. “Health Insurance Coverage in the United States: 2021.” Census Bureau. 13 Sep 2022.
Centers for Disease Control and Prevention; National Health Interview Survey. “Health Insurance Coverage: Early Release of Quarterly Estimates From the National Health Interview Survey, January 2021–March 2022.” Jul 2022.
Centers for Disease Control and Prevention; National Health Interview Survey. “Health Insurance Coverage: Early Release of Estimates From the National Health Interview Survey, 2021.” May 2022.
Berchick, Edward R. and Heide M. Jackson. “Health Insurance Coverage in the 2017 CPS ASEC Research File.” Census Bureau. 2019.
Table 1. Coverage Numbers and Rates by Type of Health Insurance, 2017: 2018 CPS ASEC Production File and 2018 CPS ASEC Bridge File. Census Bureau. 2018.
United States Courts. Confirmation Listing, Judicial Confirmations, 117th Congress. updated 13 Oct 2022.
United States Courts. Current Judicial Vacancies, 117th Congress. updated 13 Oct 2022.
United States Courts. Confirmation Listing, Judicial Confirmations for November 2018. updated 1 Nov 2018.
U.S. Customs and Border Protection. Southwest Land Border Encounters. Accessed 13 Oct 2022.
U.S. Customs and Border Protection. Nationwide Enforcement Encounters: Title 8 Enforcement Actions and Title 42 Expulsions 2022. Accessed 13 Oct 2022.
U.S. Customs and Border Protection. CBP Enforcement Statistics Fiscal Year 2022: U.S. Border Patrol Recidivism Rates. Accessed 13 Oct 2022.
U.S. Customs and Border Protection. Total Illegal Alien Apprehensions By Month, FY 2000 – FY 2020.
Reuters. “Nicaragua eliminates visa requirement for Cubans.” 23 Nov 2021.
Congressional Research Service. “2022 Summit of the Americas.” 24 Jun 2022.
White House website. “Transcript: Remarks by President Biden on the DISCLOSE Act.” 10 Sep 2022.
Southwest Border Coordination Center. “Southwest Border Strategic Concept of Operations.” 28 Mar 2022.
U.S. Department of Homeland Security. Migrant Protection Protocols. 24 Jan 2019.
U.S.. Department of Homeland Security. Court Ordered Reimplementation of the Migrant Protection Protocols. Accessed 18 Jan 2022.
Gramlich, John and Scheller, Alissa. “What’s happening at the U.S.-Mexico border in 7 charts.” Pew Research Center. 9 Nov 2021.
Alvarez, Priscilla. “Federal judge blocks Biden administration from lifting Title 42 for now.” CNN. 20 May 2022.
Schneider, Howard and Ann Saphir. “Explainer: U.S. GDP shrinks in second quarter. Is the nation in recession?” Reuters. 28 Jul 2022.
U.S. Bureau of Economic Analysis. “Table 1.1.1. Percent Change From Preceding Period in Real Gross Domestic Product.” Accessed 12 Oct 2022.
U.S. Bureau of Economic Analysis. “Gross Domestic Product (Third Estimate), GDP by Industry, and Corporate Profits (Revised), 2nd Quarter 2022 and Annual Update.” 29 Sep 2022.
National Bureau of Economic Research. “Business Cycle Dating Procedure: Frequently Asked Questions.” Revised 15 Aug 2022.
U.S. Bureau of Economic Analysis. “Consumer Spending.” 30 Sep 2022.
Federal Reserve Bank of Atlanta. “GDP Now.” 7 Oct 2022.
Board of Governors of the Federal Reserve System. “Monetary Policy Report.” 17 Jun 2022.
Fannie Mae. “Economic Indicators Continue to Point to Likely Recession in 2023.” 21 Sep 2022.
World Bank. “Risk of Global Recession in 2023 Rises Amid Simultaneous Rate Hikes.” 15 Sep 2022.
Solman, Paul. “Why corporations are reaping record profits with inflation on the rise.” PBS. 12 Apr 2022.
U.S. Bureau of Economic Analysis. “National Income by Type of Income.” 29 Sep 2022.
University of Michigan Surveys of Consumers. “Final Results for September 2022.” Accessed 10 Oct 2022.
National Association of Realtors. “Sales Price of Existing Single-Family Homes.” Accessed 10 Oct 2022.
National Association of Realtors. “Instant Reaction: Mortgage Rates, September 22, 2022.” 22 Sep 2022.
National Association of Realtors. “Existing-Home Sales Slipped 0.4% in August.” 21 Sep 2022.
Freddie Mac. “Mortgage Rates Decrease Slightly.” 6 Oct 2022.
Anas, Brittany. “Why Inventory Is So Low in the American Housing Market.” House Beautiful. 24 Jun 2022.
U.S. Census Bureau. “Time Series/Trend Charts: Not Seasonally Adjusted Home Ownership Rate.” 2 Aug 2022.
U.S. Census Bureau. “Homeownership in the United States: 2005 to 2019.” Mar 2021.
U.S. Census Bureau. “Quarterly Residential Vacancies And Homeownership, Fourth Quarter 2021.” 2 Feb 2022.
“The Biden Plan for Securing Our Values as a Nation of Immigrants.” Biden campaign. Undated, accessed 5 Jan 2022.
State Department. “Refugee Admissions Report as of June 30, 2022.” Accessed 12 Oct 2022.
State Department. “The Presidential Determination on Refugee Admissions for Fiscal Year 2022.” Press release. 8 Oct 2021.
State Department. “Report to Congress on Proposed Refugee Admissions for Fiscal Year 2022.” 20 Sep 2021.
State Department. “Report to Congress on Proposed Refugee Admissions for Fiscal Year 2023.” 8 Sep 2022.
White House. “Memorandum on Presidential Determination on Refugee Admissions for Fiscal Year 2023.” 27 Sep 2022.
U.S. Bureau of Alcohol, Tobacco, Firearms and Explosives. “Annual Firearms Manufacturing and Export Report.” Atf.gov. 18 Jul 2022.
Zimmerman, Dan. “As Crime Spirals, Americans Bought Another 1.2 Million Guns in September.” thetruthaboutguns.com. 5 Oct 2022.
U.S. Bureau of Economic Analysis. “U.S. International Trade in Goods and Services: August 2022.” Bea.gov. Accessed 11 Oct 2022.
Semega, Jessica and Melissa Kollar. “Income in the United States: 2021.” Census Bureau. Sep 2022.
Creamer, John, et. al. “Poverty in the United States: 2021.” Census Bureau. Sep 2022.
Congressional Budget Office. “Monthly Budget Review: September 2022.” Cbo.gov. 11 Oct 2022.
U.S. Department of Treasury. Debt to the Penny. Fiscaldata.treasury.gov. Accessed 13 Oct 2022.
Farley, Robert. “Biden’s Deficit Spin.” FactCheck.org. 27 Apr 2022.
U.S. Energy Information Administration. Short-Term Energy Outlook. Eia.gov. Oct 2022.
U.S. Energy Information Administration. U.S. Field Production of Crude oil. Eia.gov. Accessed 11 Oct 2022.
U.S. Energy Information Administration. U.S. Imports of Crude Oil. Eia.gov. Accessed 11 Oct 2022.
U.S. Energy Information Administration. Table 11.1 Carbon Dioxide Emissions From Energy Consumption by Source. Eia.gov. Accessed 12 Oct 2022.