Summary
Para leer en español, vea esta traducción de Google Translate.
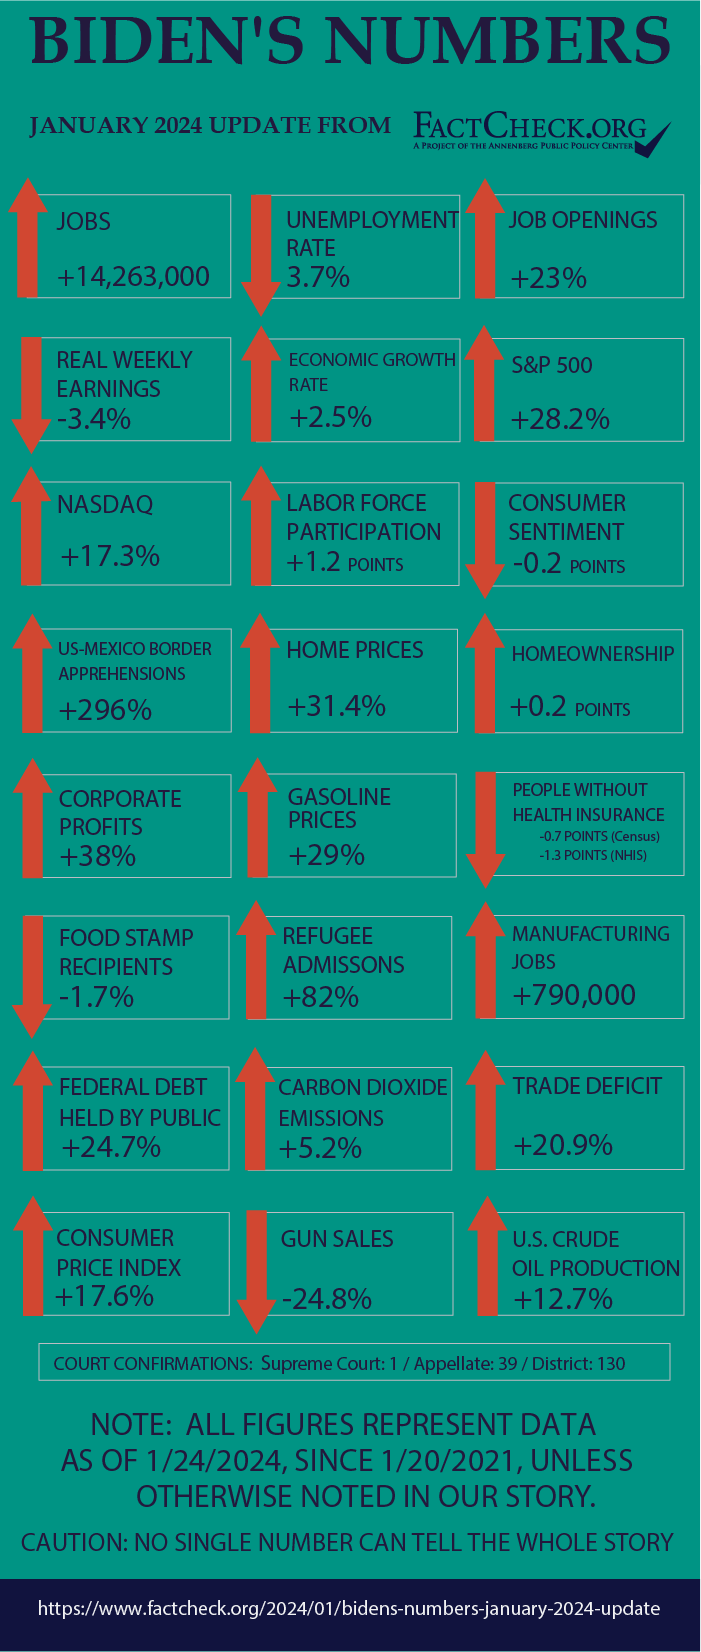
Here’s how the United States has fared since President Joe Biden took office three years ago:
- The economy added more than 14 million jobs. The number is now nearly 4.9 million higher than before the pandemic.
- The unemployment rate dropped back to just above the pre-pandemic low; unfilled job openings again outnumber unemployed job seekers.
- Inflation spiked to the highest level in over 40 years. Despite recent moderation, consumer prices are up nearly 18% overall during Biden’s time. Gasoline is up 29%.
- Average weekly earnings haven’t kept pace with prices. After adjusting for inflation, “real” weekly earnings declined 3.4%.
- Defying expectations, the nation’s economy expanded 2.5% in 2023, marking the third straight year of economic growth.
- Crime data show a decrease in murders in U.S. cities in 2022 and 2023.
- The S&P 500 has increased 28.2%.
- The number of apprehensions of those trying to cross the southern border illegally remains near historical highs. For the 12 months ending in November, apprehensions are up 296%.
- For the third straight year, gun purchases declined, as measured by background checks for firearm sales.
- Crude oil production is up 12.7%; imports are up 8.7%.
- The trade deficit for goods and services is about 20.9% higher.
- The number of people without health insurance has gone down; enrollment in Affordable Care Act marketplace plans is at its highest point yet.
- The number of people receiving federal food assistance has declined by more than 700,000.
- The publicly held debt has increased by about 24.7%.
Analysis
Biden, who appears to be headed for a rematch with former President Donald Trump, is going into an election year with some favorable and unfavorable numbers. Unemployment is down, and consumer confidence is rising. But overall inflation is high, and wages aren’t keeping pace with inflation.
Here, we present those and other statistical measures in our latest installment of our quarterly feature, “Biden’s Numbers.” We take no position on how much credit or blame Biden deserves, following the same approach we took when we did “Trump’s Numbers.”
Jobs and Unemployment
The number of people with jobs rebounded strongly during Biden’s time, surpassing pre-pandemic levels by almost 4.9 million.
Employment — The U.S. economy added 14,263,000 jobs between Biden’s inauguration and December, the latest month for which data are available from the Bureau of Labor Statistics. The December figure is 4,861,000 higher than the February 2020 peak of employment before COVID-19 forced massive shutdowns and layoffs.
Some categories are still lagging, however. There were 28,000 fewer public school teachers and other local government education workers in December than there were at the pre-pandemic peak, and 183,000 fewer hotel and restaurant workers and others in the accommodation and food services industries.
Unemployment — The unemployment rate fell from 6.4% at the time Biden took office to 3.4% in January 2023 and again in April, the lowest since June 1969. Since then, the rate has crept up — but only to 3.7% in December, just 0.2 point above the pre-pandemic rate.
Job Openings — The number of unfilled job openings soared, reaching a record of over 12 million in March 2022, but then declined after the Federal Reserve began a steep series of interest rate increases aimed at cooling the economy to bring down price inflation.
The number of unfilled jobs was just under 8.8 million as of the last business day of November, the most recent month on record. That’s still an increase of over 1.6 million openings — or nearly 23% — during Biden’s time.
In November, there was an average 1.4 jobs for every unemployed job seeker. When Biden took office, there were fewer job openings than unemployed job seekers.
The number of job openings in December is set to be released Jan. 30.
Labor Force Participation — One reason many job openings go unfilled is that millions of Americans left the workforce during the pandemic and haven’t returned. The labor force participation rate (the percentage of the total population over age 16 that is either employed or actively seeking work) has risen slowly during Biden’s time, from 61.3% in January 2021 to 62.5% in December.
That still leaves the rate somewhat short of the pre-pandemic level of 63.3% for February 2020.
The rate has been trending generally down for nearly a quarter of a century. It peaked at 67.3% during the first four months of 2000. Labor Department economists project that the rate will continue to slide down to 60.1% in 2031, “primarily because of an aging population.”
Manufacturing Jobs — During the presidential campaign, Biden promised he had a plan to create a million new manufacturing jobs — and whether it’s his doing or not, the number is getting close to that target.
As of December, the U.S. added 790,000 manufacturing jobs during Biden’s time, a 6.5% increase in the space of 35 months, according to the BLS. Furthermore, the December total is 201,000, or 1.6%, above the number of manufacturing jobs in February 2020, before the pandemic forced plant closures and layoffs.
During Trump’s four years, the economy lost 170,000 manufacturing jobs, or 1.4%, largely due to the pandemic.
Wages and Inflation
CPI — Inflation came roaring back under Biden. During his first 35 months in office, the Consumer Price Index rose 17.6%.
It was for a time the worst inflation in decades. The 12 months ending in June 2022 saw a 9.1% increase in the CPI (before seasonal adjustment), which the Bureau of Labor Statistics said was the biggest such increase since the 12 months ending in November 1981.
Inflation has moderated greatly since then. The unadjusted CPI rose 3.4% in the 12 months ending in December, the most recent figure available.
Gasoline Prices — The price of gasoline shot up even faster.
During the week ending Jan. 22, the national average price of regular gasoline at the pump was $3.06. That’s 68 cents higher than in the week before Biden took office, an increase of 29%.
The price swung wildly during Biden’s first year and a half, hitting a record high of just over $5 per gallon in the week ending June 13, 2022. That rise was propelled by motorists resuming travel after pandemic lockdowns and then by Russia’s invasion of Ukraine on Feb. 24, 2022.
Wages — Wages also have gone up under Biden, but not as fast as prices.
Average weekly earnings for rank-and-file workers went up 14.2% during Biden’s first 35 months in office, according to monthly figures compiled by the BLS. Those production and nonsupervisory workers make up 81% of all employees in the private sector.
But inflation ate up all that gain and more. “Real” weekly earnings, which are adjusted for inflation and measured in dollars valued at their average level in 1982-84, actually declined 3.4% since Biden took office.
More recently, real wages have been increasing, rising 1.3% since hitting the low point under Biden in June 2022.
Economic Growth
After the Federal Reserve began raising interest rates in March 2022 to slow inflation, the economic consensus held that the U.S. was headed for a recession in 2023. That turned out not to be the case.
In fact, real gross domestic product (which is adjusted for inflation) was 2.5% higher in 2023 than it was in 2022, the Bureau of Economic Analysis said in a Jan. 25 release announcing its “advance estimate.” (The advance estimate is the BEA’s first estimate, which could be adjusted slightly on Feb. 28, when updated figures with more complete data will be released.)
This marks the third straight year of economic growth under Biden. The real GDP increased 5.8% in 2021 and 1.9% in 2022. (In 2020, Trump’s final year in office, the U.S. economy was battered by the COVID-19 pandemic, and real GDP declined 2.2%.)
The BEA also estimated that the economy increased at an annual rate of 3.3% in the fourth quarter of 2023 — marking the sixth straight quarter of economic growth, including a surprisingly strong 4.9% increase in the third quarter.
The Fed’s monetary policy was designed “to achieve a ‘soft landing’ — a return to low inflation while maintaining moderate economic growth,” as the nonpartisan Congressional Research Service explained in a report released last month. But, the CRS report added, “a majority of private sector economists had, until recently, predicted that the Fed’s actions would result in a ‘hard landing’ — a recession — in 2023.”
The economic consensus now is that the Fed has achieved a “soft landing,” and the U.S. will likely avoid a recession, according to the Wall Street Journal’s most recent quarterly survey of economists in early January.
“Business and academic economists surveyed by the Journal lowered the probability of a recession within the next year, to 39% from 48% in the October survey,” the Journal wrote on Jan. 14. That’s the lowest it has been since April 2022, when the average probability of a recession was 28%.
In December, the nonpartisan Congressional Budget Office projected that the nation’s economic growth will slow to 1.5% in 2024 — which, if that happens, would mean the Fed had indeed achieved a “soft landing.”
Of course, the economic consensus has been wrong before.
Crime
The available data show that homicides declined nationwide last year, though you wouldn’t know it from recently released research from the Republican National Committee. The RNC report decried 2023 as “another violent year” that “continues the violent wave of crime that has been building for the past few years, ever since the defund the police movement – championed by Democrats – began.”
The RNC report highlights a rise in homicides in Washington, D.C., Kansas City and Memphis. While it’s true that homicides rose in those cities, figures from AH Datalytics, an independent criminal justice data analysis group, show that murders in more than 200 cities nationwide were down 12% overall in 2023 compared with 2022.
The latest figures from the Major Cities Chiefs Association show a 10.7% decline in the number of murders from Jan. 1 to Sept. 30, 2023, compared with the same time period in 2022, in 69 large U.S. cities.
There was also a drop in murders in large cities in 2022. These decreases come after a 33.4% increase in the number of murders in large cities from 2019 to 2020, according to the Major Cities Chiefs Association, and a smaller 6.2% rise from 2020 to 2021, Biden’s first year in office.
The nonpartisan think tank Council on Criminal Justice published a midyear report in 2023 on 30 U.S. cities that similarly found recent declines in homicides. However, it noted that the number for the first half of 2023 remained higher than the first half of 2019, “the year prior to the COVID pandemic and racial justice protests of 2020.”
“The authors conclude that crime patterns continue to shift as the nation has emerged from the COVID pandemic and that policymakers and communities must act urgently to adapt their strategies to meet the new challenges,” CCJ said in a summary of its report. “Though the level of serious violent crime is far below historical peaks, it remains intolerably high, especially in poorer communities of color.”
Our last “Biden’s Numbers” update in October included the just-released FBI report covering 2022. Its estimates showed a drop in the nationwide murder and nonnegligent manslaughter rate of 0.5 points during Biden’s time in office, from 6.8 per 100,000 population in 2020 to 6.3 in 2022. The number of murders declined by 5.6%, totaling an estimated 21,156 last year.
The violent crime rate dropped by 15.4 points, to 369.8 per 100,000 population in 2022.
As we noted then, the decrease in murder and aggravated assaults under Biden, however, hasn’t yet brought those figures back to their 2019 levels, before an increase in both offenses during the 2020 pandemic. For instance, the 6.3 murder rate for 2022 is still higher than the 5.2 rate for 2019.
The FBI’s 2022 report is based on figures voluntarily provided by 15,724 law enforcement agencies, which represent 93.5% of the U.S. population. All U.S. cities with 1 million population or more provided statistics for the full year, the FBI said.
The property crime rate also declined a bit, by 9.5 points, from 2020 to 2022. But there was a notable increase in motor vehicle thefts: The rate increased by 35.2 points to 282.7 vehicle thefts per 100,000 people.
Immigration
The number of apprehensions of those trying to cross the southern border illegally crept back up in September, October and November, remaining near historical highs. Overall under Biden, apprehensions are dramatically higher than the apprehension numbers under Trump, according to the latest data from U.S. Customs and Border Protection.
To even out the seasonal changes in border crossings, we compare the most recent 12 months on record with the year before Biden took office. And for the past 12 months ending in November, the latest figures available, apprehensions totaled 2,012,917, according to Customs and Border Protection. That’s 296% higher than during Trump’s last year in office.
Driving much of the increase has been a boom in migrants seeking asylum. (See chart below.)
Rather than trying to sneak into the interior, most migrants are crossing into the U.S. and turning themselves over to border authorities, Colleen Putzel-Kavanaugh, an associate policy analyst at the Migration Policy Institute, told us. “They want to be encountered by border patrol agents.”
Explaining the push on the border, Putzel-Kavanaugh said, “Part of it is because migration worldwide has increased,” due to unequal recovery from the pandemic, wars/violence, the loosening of restrictions after COVID-19 and climate change. “We are seeing more turmoil around the world.”
There are also unique pull factors to the U.S., she said.
“After the Trump administration, there was a perception that Biden was the opposite of Trump on immigration,” Putzel-Kavanaugh said. “There was a perception that the U.S. was more welcoming. There was a stark difference in the way they talked about migrants.”
It’s also true that most migrants have been able to find work, she said, which acts as a draw.
Adding to the problem, she said, is that the asylum system is incredibly backlogged.
“Cases don’t come to trial until years down the line,” she said. Asylum cases are taking four to five years to come to trial. In some cases, like in New York, the backlog is even longer, she said.
Less than 15% of those seeking asylum were ultimately granted it in fiscal years 2022 and 2023, according to Justice Department statistics. But while waiting on a decision, asylum seekers obtain work authorizations, get established in jobs and their children get settled in schools, Putzel-Kavanaugh said.
According to a December report from TRAC, a nonpartisan research center at Syracuse University, the immigration court backlog reached a record of 3 million pending cases in November, after growing by a million in just one year.
“Immigration Judges are swamped,” the report stated. “Immigration Judges now average 4,500 pending cases each. If every person with a pending immigration case were gathered together, it would be larger than the population of Chicago, the third largest city in the United States.”
Republicans and Democrats alike have been calling for immigration policy changes, though their plans are very different. Biden has called for addressing the root causes of immigration by sending more assistance to improve conditions in countries like El Salvador, Guatemala and Honduras. He also seeks funds to reduce immigration court and asylum application backlogs.
Republicans, meanwhile, are calling for a return to some of the policies championed by Trump, such as expanding the border wall system, reinstituting the “Remain in Mexico” policy (whereby asylum seekers had to stay in Mexico to await their court appearances), and returning to using U.S. Title 42, a public health order that was used during the pandemic to allow border officials to immediately return migrants caught trying to enter the country illegally.
Also, House Republicans are pursuing impeachment of Homeland Security Secretary Alejandro Mayorkas. A resolution proposed by Republican Rep. Marjorie Taylor Greene claims Mayorkas has not upheld a requirement in the Secure Fence Act of 2006 that the secretary of Homeland Security “maintain operational control” over the border, a standard that Mayorkas noted no DHS secretary has ever met to the letter of the law.
Refugees
Biden continues to make slow, but steady, progress toward fulfilling his ambitious campaign promise to accept up to 125,000 refugees into the United States each fiscal year.
On Sept. 29, the Biden administration set the cap on refugee admissions for fiscal year 2024 at 125,000 – just as it did in fiscal years 2023 and 2022.
In fiscal year 2023, which ended Sept. 30, the U.S. accepted 60,014 refugees — the highest total since fiscal year 2016, which was the last full fiscal year of the Obama-Biden administration, according to State Department data. It was also more than twice as many as the 25,465 refugees admitted in fiscal 2022.
But it still fell far short of the president’s 125,000 goal. To achieve that goal, the administration would have to admit an average of 10,417 refugees per month.
In the first three months of fiscal year 2024, the administration accepted 21,790 refugees — or 7,263 per month. That’s substantially higher than the 6,757 refugees — or 2,252 per month — who were admitted in the first three months of last fiscal year.
“Refugee admissions now are nearing a monthly pace that will, if sustained over the course of a year, enable arrival of 125,000 refugees, a 30-year high,” the State Department said in a November report to Congress. The mention of “a 30-year high” in the report refers to 1992, when the Clinton administration admitted 132,531 refugees, according to data compiled by the Migration Policy Institute.
The State Department report credited the Biden administration’s “intensive efforts to restore, strengthen, and modernize the U.S. Refugee Admissions Program” as the reason for making “significant progress” toward Biden’s 125,000 goal. (Note: Only refugees, who apply for refugee status from outside the U.S., count against the refugee admissions ceiling, as the State Department explains in its report to Congress.)
Overall, the U.S. has admitted 117,277 refugees in Biden’s first full 35 months in office, or 3,351 refugees per month, the data show. That’s 82% higher than the 1,845 monthly average during the four years under Trump, who significantly reduced the admission of refugees. (For both presidents, our monthly averages include only full months in office, excluding the month of January 2017 and January 2021, when administrations overlapped.)
Judiciary Appointments
Supreme Court — Biden has appointed one Supreme Court justice, Ketanji Brown Jackson, who was confirmed on April 7, 2022. She replaced retired Justice Stephen G. Breyer, an appointee of President Bill Clinton. At the same point of his tenure, Trump had won confirmation for two Supreme Court justices.
Court of Appeals — Thirty-nine U.S. Court of Appeals judges have been confirmed under Biden, while 50 had been confirmed at this point of Trump’s term.
District Court — Biden has won confirmation for 130 District Court judges. At the same point under Trump, 133 had been confirmed.
Four U.S. Court of Federal Claims judges have also been confirmed under Biden, while five had been confirmed at the same point of Trump’s presidency. In addition, Trump had won the confirmation for two U.S. Court of International Trade judges at this stage of his term.
As of Jan. 24, there were 60 federal court vacancies, with 23 nominees pending.
Health Insurance Coverage
The number of people without health insurance decreased by 0.7 percentage points or 2.4 million people from 2020, the year before Biden took office, to 2022. Those figures come from the Census Bureau’s annual reports, which measure those who lacked insurance for the entire year.
The latest report, published in September, found that 25.9 million people, or 7.9% of the population, didn’t have insurance in 2022.
The Centers for Disease Control and Prevention’s National Health Interview Survey provides more recent, early release estimates that measure those who lacked health insurance at the time they were interviewed. By that metric, the uninsured dropped by 1.3 percentage points, or 4 million people, from 2020 to 2022, and the latest NHIS report shows a further decline for the first nine months of 2023.
From January through June last year, 7.4% of the population was uninsured, according to the NHIS estimates, 1 percentage point lower than the figure for all of 2022.
As we have been noting, it’s possible the uninsured figures will start to rise, since some Medicaid provisions that were enacted during the coronavirus pandemic started to be phased out at the end of March last year.
Enrollment in the Affordable Care Act’s marketplace plans — for those who need to buy coverage on their own — has increased under Biden. The Department of Health and Human Services announced on Jan. 24 that 21.3 million people had selected an ACA plan during this year’s open enrollment period, the highest figure yet and about 5 million more than last year. This year’s enrollment also includes more than 5 million consumers who are new to the ACA marketplace.
Corporate Profits
After-tax corporate profits have reached new heights under Biden.
For the year, after-tax corporate profits set records in 2021 and 2022, according to BEA estimates. (See line 45.)
On Dec. 21, the BEA estimated that profits in the third quarter of 2023 grew to an annualized rate of $3.02 trillion. That was 38% higher than the full-year figure for 2020, the year before Biden took office.
It was the third straight quarter that corporations had seen an increase in profits.
Consumer Sentiment
Under Biden, high inflation had weakened consumer confidence in the economy. But inflation has been slowing, and confidence is picking up once again.
The University of Michigan’s Surveys of Consumers reported that its preliminary Index of Consumer Sentiment for January was 78.8 — the highest since July 2021.
“Consumer sentiment soared 13% in January to reach its highest level since July 2021, showing that the sharp increase in December was no fluke,” Joanne W. Hsu, director of the Surveys of Consumers, said. “Consumer views were supported by confidence that inflation has turned a corner and strengthening income expectations. Over the last two months, sentiment has climbed a cumulative 29%, the largest two-month increase since 1991 as a recession ended.”
In June 2022, the consumer sentiment index dropped to a record-low 50, according to survey data since November 1952. But now it is almost back to where it was when Biden took office in January 2021, when the index was 79.
The Conference Board’s Consumer Confidence Survey also reported an increase in December. The group said its survey showed “a surge in confidence and restored optimism for 2024.” The Conference Board will release its next survey on Jan. 30.
Home Prices & Homeownership
Home prices — After skyrocketing in Biden’s first two years, home prices have cooled, peaking in June and declining ever since.
The preliminary median sales price of existing single-family homes in the U.S. was $387,000 in December, marking the sixth consecutive month that prices have dropped, according to the National Association of Realtors.
For the year, the median sales price was $394,600 — just a shade higher than it was in 2022. Even so, the median price in 2023 was 31.4% higher than it had been in 2020.
But NAR Chief Economist Lawrence Yun isn’t expecting the real estate dip to last much longer.
“The latest month’s sales look to be the bottom before inevitably turning higher in the new year,” Yun said in a Jan. 19 press release. “Mortgage rates are meaningfully lower compared to just two months ago, and more inventory is expected to appear on the market in upcoming months.”
Mortgage rates had been rising along with the Federal Reserve’s key interest rate. The Fed last raised its benchmark rate in July — marking the 11th increase since March 2022. In December, Federal Reserve Chairman Jerome Powell indicated that its next move may be to cut its rate.
The 30-year fixed rate mortgage average nationwide, as of Jan. 18, dropped to 6.6% — the lowest since May, according to Freddie Mac.
Homeownership — Homeownership rates have barely budged under Biden.
The homeownership rate, which the Census Bureau measures as the percentage of “occupied housing units that are owner-occupied,” was 66% in the third quarter of 2023 — not much higher than the 65.8% rate during Trump’s last quarter in office. (Usual word of caution: The bureau warns against making comparisons with the fourth quarter of 2020, because of pandemic-related restrictions on in-person data collection.)
The rate peaked under Trump in the second quarter of 2020 at 67.9%. The highest homeownership rate on record was 69.2% in 2004, when George W. Bush was president.
Stock Markets
The stock markets have rallied since our last report, finishing 2023 strong and setting records in 2024.
All three major indexes saw double-digit increases in 2023. The S&P 500 index “ended the year with a 24.2% gain. The Dow Jones Industrial Average rose more than 13% this year, and the Nasdaq soared 43%, driven by gains in big technology companies, including Nvidia, Amazon and Microsoft,” CBS News reported on Dec. 29, the last day of trading.
That pushed all three indexes solidly into positive territory on Biden’s watch.
The S&P 500, which is made up of 500 large-cap companies, set a new high on Jan. 24, closing at 4,868.55. Since Biden took office, the S&P 500 has increased 28.2%. Likewise, the Dow Jones Industrial Average, which includes 30 large corporations, has increased 22.2% under Biden.
The technology-heavy NASDAQ composite index, made up of more than 3,000 companies, was in negative territory under Biden in our last report in October. But at the close on Jan. 24, the NASDAQ index was up 17.3% since Biden took office on Jan. 20, 2021.
Gun Sales
For the third straight year, since a spike during the pandemic, annual gun purchases appear to have declined, according to figures from the National Shooting Sports Foundation.
The federal government doesn’t collect data on gun sales, so the NSSF, a gun industry trade group, estimates gun sales by tracking the number of background checks for firearm sales based on the FBI’s National Instant Criminal Background Check System, or NICS. The NSSF-adjusted figures exclude background checks unrelated to sales, such as those required for concealed-carry permits.
The adjusted NICS total for background checks in 2023 was more than 15.8 million, the NSSF said — the fourth-highest annual total going back to 2000. But last year’s total was still about 3.5% less than in 2022, approximately 14.4% less than in 2021, and roughly 24.8% less than in 2020, the one-year record.
Oil Production and Imports
U.S. crude oil production averaged roughly 12.76 million barrels per day during Biden’s most recent 12 months in office (ending in October), according to U.S. Energy Information Administration data published in late December. That was more than 12.7% higher than the average daily amount of crude oil produced in 2020.
In its Short-Term Energy Outlook for January, the EIA projected that crude oil production averaged 12.92 million barrels per day in 2023, which would be the highest average on record. EIA also said it expects crude oil production — fueled by increases in well efficiency — to increase to 13.2 million barrels per day in 2024 and 13.4 million in 2025, which would be new records.
Still, over the last 12 months, the U.S. imported about 6.39 million barrels of crude oil per day on average. That’s up more than 8.7% from average daily imports in 2020 — but lower than the pre-pandemic average of 6.80 million barrels per day in 2019.
Carbon Emissions
There was another small decline in U.S. carbon dioxide emissions since our last report.
In the most recent 12 months on record (ending in September), there were approximately 4.82 billion metric tons of emissions from the consumption of coal, natural gas and various petroleum products, according to the EIA. That’s down from the 4.83 billion metric tons as of our last update, but it’s still about 5.2% more than the roughly 4.58 billion metric tons emitted in 2020.
As of this month, the EIA forecast that energy-related emissions for all of 2023 would total 4.78 billion metric tons — which would be lower than the amounts of 4.90 billion in 2021 and 4.94 billion in 2022.
Trade
The U.S. imported roughly $789.4 billion more in goods and services than it exported over the last 12 months through November, according to figures published this month by the Bureau of Economic Analysis. The international trade deficit in that period was $136.5 billion higher, or about 20.9% more, than the gap for the 2020 calendar year.
However, as of November, the 2023 goods and services deficit had decreased by around $161.8 billion from the same 11-month period in 2022 — putting the U.S. on pace to have a lower annual trade deficit last year than the record of $951.2 billion in 2022.
Food Stamps
Since our last quarterly update, enrollment in the Supplemental Nutrition Assistance Program, formerly known as food stamps, increased.
There were about 41.4 million beneficiaries receiving food assistance through SNAP, as of October. The figures, which are preliminary, were published by the Department of Agriculture earlier this month.
That means SNAP enrollment is up 96,392 since July — but still down 718,269, or about 1.7%, from the January 2021 enrollment of more than 42.1 million. The lowest monthly enrollment under Biden was roughly 40.8 million in August and September 2021.
Debt and Deficits
Debt — The public debt, excluding money the government owes itself, increased to more than $26.9 trillion, as of Jan. 19. The public debt is now about 24.7% higher than it was when Biden took office.
Deficits — The Congressional Budget Office estimates that so far the budget deficit for fiscal year 2024 has increased a bit compared with the same period in fiscal 2023, when the annual deficit was $1.7 trillion, according to the Department of Treasury.
Through the first three months of the current fiscal year (October to December), the deficit was $509 billion, or “$87 billion more than the deficit recorded during the same period last fiscal year,” the CBO reported in its Monthly Budget Review for December 2023.
Notably, the CBO said that outlays in the first quarter were up $170 billion from the same time a year ago — and would have been slightly higher if not for some federal payments being made in the last month of fiscal 2023 instead of the first month of fiscal 2024. A significant contributor to the increase was interest payments on the debt, the CBO said, “because interest rates are significantly higher than they were in the first three months of fiscal year 2023.”
Editor’s note: FactCheck.org does not accept advertising. We rely on grants and individual donations from people like you. Please consider a donation. Credit card donations may be made through our “Donate” page. If you prefer to give by check, send to: FactCheck.org, Annenberg Public Policy Center, P.O. Box 58100, Philadelphia, PA 19102.
Sources
U.S. Bureau of Labor Statistics. “Employment, Hours, and Earnings from the Current Employment Statistics survey (National): Total Nonfarm.” Accessed 12 Jan 2024.
U.S. Bureau of Labor Statistics. “Labor Force Statistics from the Current Population Survey: Unemployment.” Accessed 12 Jan 2024.
U.S. Bureau of Labor Statistics. “Job Openings and Labor Turnover Survey: Job Openings.” Accessed 12 Jan 2024.
U.S. Bureau of Labor Statistics. “Labor Force Statistics from the Current Population Survey: Labor Force Participation Rate.” Accessed 12 Jan 2024.
U.S. Bureau of Labor Statistics. Monthly Labor Review. “Projections overview and highlights, 2021–31” Nov 2022.
U.S. Bureau of Labor Statistics. “Employment, Hours, and Earnings from the Current Employment Statistics survey (National): Manufacturing.” Accessed 12 Jan 2024.
U.S. Bureau of Labor Statistics. “Consumer Price Index – All Urban Consumers (Seasonally Adjusted).” Data extracted 12 Jan 2024.
U.S. Bureau of Labor Statistics. Consumer Price Index Summary. News release. 13 Jul 2022.
U.S. Bureau of Labor Statistics. Consumer Price Index Summary. News release. 11 Jan 2024.
U.S. Energy Information Administration. “Weekly U.S. Regular All Formulations Retail Gasoline Prices.” Data extracted 23 Jan 2024.
U.S. Bureau of Labor Statistics. “Employment, Hours and Earnings from the Current Employment Statistics survey (National); Average Weekly Earnings of Production and Nonsupervisory Employees, total private.” Data extracted 12 Jan 2024.
U.S. Bureau of Labor Statistics. “Employment, Hours and Earnings from the Current Employment Statistics survey (National); Average Weekly Earnings of Production and Nonsupervisory Employees, 1982-1984 dollars, total private.” Data extracted 12 Jan 2024.
U.S. State Department. “Presidential Determination on Refugee Admissions for Fiscal Year 2022.” 8 Oct 2021.
“The Biden Plan for Securing Our Values as a Nation of Immigrants.” Biden campaign. Undated, accessed 5 Jan 2022.
State Department. “Refugee Admissions Report.” 31 Dec 2023.
White House. “Presidential Determination on Refugee Admissions for Fiscal Year 2023.” 27 Sep 2022.
State Department. “Presidential Determination on Refugee Admissions for Fiscal Year 2024.” 29 Sep 2023.
State Department. “Report to Congress on Proposed Refugee Admissions for Fiscal Year 2024.” 3 Nov 2023.
“U.S. Annual Refugee Resettlement Ceilings and Number of Refugees Admitted, 1980-Present.” Migration Policy Institute. Updated, accessed 6 Oct 2023.
Tepper, Taylor and Benjamin Curry. “Federal Funds Rate History 1990 to 2023.” Forbes Advisor. 17 Oct 2023.
The Conference Board. “US recession probability reaches 96 percent heading into Q4.” 29 Sep 2022.
U.S. Bureau of Economic Analysis. “Table 1.1.1. Percent Change From Preceding Period in Real Gross Domestic Product.” Accessed 25 Jan 2024.
The Conference Board. “US Consumer Confidence Increased Again in December.” 20 Dec 2023
U.S. Bureau of Economic Analysis. “Gross Domestic Product, 4th Quarter and Year 2023 (Advance Estimate).” 25 Jan 2024.
Torry, Harriet and Anthony DeBarros. “Economists Now Expect a Recession, Job Losses by Next Year.” Wall Street Journal. 16 Oct 2022.
Smith, Gary N. “Recession was inevitable, economists said. Here’s why they were wrong.” MarketWatch. 22 Jan 2024.
U.S. Bureau of Economic Analysis. “Table 1.1.1. Percent Change From Preceding Period in Real Gross Domestic Product.” Accessed 23 Jan 2024.
Mutikani, Lucia. “COVID-19 savages U.S. economy, 2020 performance worst in 74 years.” Reuters. 28 Jan 2021.
Weinstock, Lida R. and Marc Labonte. “Has the Federal Reserve Achieved a Soft Landing in 2023?” Congressional Research Service. 11 Dec 2023.
Torry, Harriet and Anthony DeBarros. “It Won’t Be a Recession—It Will Just Feel Like One.” Wall Street Journal. 14 Jan 2024.
“CBO’s Current View of the Economy From 2023 to 2025.” Congressional Budget Office. 15 Dec 2023.
Brown, Courtenay. “U.S. economy will pull off soft landing in 2024, CBO projects.” Axios. 15 Dec 2023.
Wallace, Alicia. “Consumer sentiment plunges to record low amid surging inflation.” 10 Jun 2022.
Jay, Marley. “Inflation slows to 3.1%, signaling continued moderation of consumer price increases.” 11 Dec 2023.
University of Michigan Surveys of Consumers. “Preliminary Results for January 2024.” Accessed 19 Jan 2024.
University of Michigan Surveys of Consumers. “The Index of Consumer Sentiment.” Accessed 19 Jan 2024.
US Census Bureau. “Business and Industry: Homeownership rates.” Accessed 22 Jan 2024.
Mateyka, Peter, and Mazur, Christopher. “Homeownership in the United States: 2005 to 2019.” U.S. Census Bureau. Mar 2021.
U.S. Census Bureau. “Quarterly Residential Vacancies And Homeownership, Fourth Quarter 2021.” 2 Feb 2022.
U.S. Bureau of Economic Analysis. “National Income by Type of Income.” 22 Jan 2024.
Keisler-Starkey, Katherine et. al. “Health Insurance Coverage in the United States: 2022.” Census Bureau. Sep 2023.
Keisler-Starkey, Katherine et. al. “Health Insurance Coverage in the United States: 2021.” Census Bureau. 13 Sep 2022.
Tolbert, Jennifer and Meghana Ammula. “10 Things to Know About the Unwinding of the Medicaid Continuous Enrollment Provision.” KFF. 5 Apr 2023.
Centers for Disease Control and Prevention; National Health Interview Survey. “Health Insurance Coverage: Early Release of Estimates From the National Health Interview Survey, 2022.” May 2023.
Centers for Disease Control and Prevention; National Health Interview Survey. “Health Insurance Coverage: Early Release of Estimates From the National Health Interview Survey, January–June 2023.” Dec 2023.
Department of Health and Human Services. “Historic 21.3 Million People Choose ACA Marketplace Coverage.” press release. 24 Jan 2024.
KFF. Marketplace Enrollment, 2014-2023. accessed 24 Jan 2024.
Republican National Committee. “Biden’s Capitulation To Crime.” 18 Jan 2024.
Pope, Troy and De Alba, Simone. “‘Grief is a mountain’ | Homicides in DC were up 36% in 2023 – the most in 20 years.” WUSA9. 2 Jan 2024.
Moore, Katie et al. “Kansas City metro records 246 homicides in 2023. Here are the details of each killing.” Kansas City Star. 1 Jan 2024.
Royer, David. “As U.S. crime trends down, murders rise in Memphis.” WREG. 29 Dec 2023.
Major Cities Chiefs Association. Violent Crime Survey — National Totals, January 1 to September 30, 2023, and 2022. Accessed 22 Jan 2024.
Major Cities Chiefs Association. Violent Crime Survey — National Totals, January 1 to December 31, 2020, and 2019. Accessed 22 Jan 2024.
Council on Criminal Justice. “Crime Trends in U.S. Cities: Mid-Year 2023.” Jul 2023.
Kiely, Eugene et al. “Biden’s Numbers, October 2023 Update.” FactCheck.org. 20 Oct 2023.
Federal Bureau of Investigation. “UCR Summary of Crime in the Nation, 2022.” Accessed 22 Jan 2024.
U.S. Customs and Border Protection. Southwest Land Border Encounters. Accessed 22 Jan 2024.
Department of Justice. Executive Office for Immigration Review Adjudication Statistics — Asylum Decision Rates. Accessed 22 Jan 2024.
TRAC Immigration. “Immigration Court Backlog Tops 3 Million; Each Judge Assigned 4,500 Cases.” Syracuse University. 18 Dec 2023.
White House Website. “Fact Sheet: President Biden Sends Immigration Bill to Congress as Part of His Commitment to Modernize our Immigration System.” 20 Jan 2021.
Brooks, Emily and Beitsch, Rebecca. “GOP’s Mayorkas impeachment push races ahead of Biden probe.” The Hill. 22 Jan 2024.
United States Courts. Confirmation Listing, Judicial Confirmations for January 2023, 117th Congress. Updated 1 Jan 2023.
United States Courts. Confirmation Listing, Judicial Confirmations, 118th Congress. updated 24 Jan 2024.
United States Courts. Current Judicial Vacancies, 118th Congress. updated 24 Jan 2024.
United States Courts. Confirmation Listing, Judicial Confirmations for January 2019, 115th Congress. updated 1 Jan 2019.
United States Courts. Confirmation Listing, Judicial Confirmations for February 2020, 116th Congress. updated 1 Feb 2020.
The State. “Jacquelyn Austin confirmed by U.S. Senate. She will be SC’s newest federal judge.” 24 Jan 2024.
@JudiciaryDems. “CONFIRMED: Cristal Brisco to the Northern District of Indiana.” X. 24 Jan 2024.
“NSSF-Adjusted NICS Background Checks for December, Q4 and Annual 2023.” Shooting Wire. 5 Jan 2024.
National Shooting Sports Foundation. “NSSF-Adjusted NICS – Historical Monthly Chart.” 17 Jan 2023.
U.S. Energy Information Administration. Short-Term Energy Outlook. 9 Jan 2024.
U.S. Energy Information Administration. U.S. Field Production of Crude Oil. Accessed 23 Jan 2024.
U.S. Energy Information Administration. U.S. Imports of Crude Oil. Accessed 23 Jan 2024.
U.S. Energy Information Administration. Monthly Energy Review. Table 11.1 Carbon Dioxide Emissions From Energy Consumption by Source. 21 Dec 2023.
U.S. Bureau of Economic Analysis. U.S. Trade in Goods and Services, 1960-present. 9 Jan 2024, accessed 22 Jan 2024.
U.S. Bureau of Economic Analysis. “U.S. International Trade in Goods and Services, November 2023.” 9 Jan 2024.
U.S. Department of Agriculture. Supplemental Nutrition Assistance Program. Persons, Households, Benefits, and Average Monthly Benefit per Person & Household. 12 Jan 2024.
U.S. Department of Treasury. Debt to the Penny. Accessed 23 Jan 2024.
Congressional Budget Office. “Monthly Budget Review: December 2023.” 9 Jan 2024.
U.S. Department of Treasury. “Joint Statement of Janet L. Yellen, Secretary of the Treasury, and Shalanda D. Young, Director of the Office of Management and Budget, on Budget Results for Fiscal Year 2023.” Press release. 20 Oct 2023.
S&P Global. “Dow Jones Industrial Average.” Accessed 24 Jan 2024.
S&P Global. “S&P 500.” Accessed 24 Jan 2024.
Yahoo! Finance. “NASDAQ Composite.” Accessed 24 Jan 2024.
Yahoo! Finance. “Dow Jones Industrial Average.” Accessed 24 Jan 2024.
Yahoo! Finance. “S&P 500.” Accessed 24 Jan 2024.
Banerji, Gunjan. “Dow Climbs Above 38000 to a Record; S&P 500 Reaches High.” Wall Street Journal. 22 Jan 2024.
“Stocks close out 2023 with a 24% gain, buoyed by a resilient economy.” CBS News. 29 Dec 2023.
Randewich, Noel and Johann M. Cherian. “S&P 500 ekes out another record high as Netflix and chipmakers leap.” Reuters. 24 Jan 2024.