Summary
In our seventh installment of this feature, gauging how various factors have changed under President Joe Biden, we found:
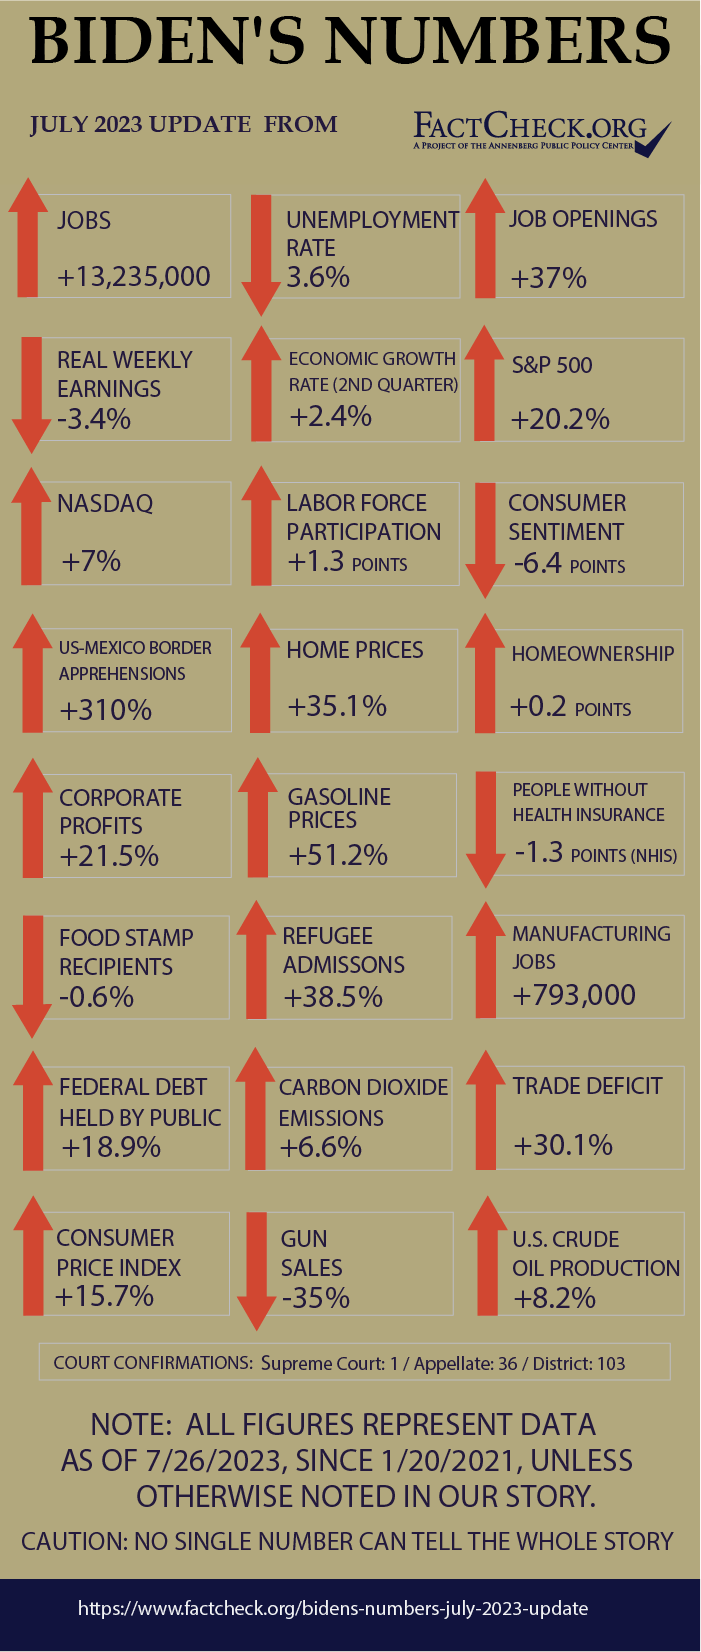
- The economy added 13.2 million jobs under Biden, putting the total 3.8 million higher than before the pandemic.
- The unemployment rate dropped for a time to the lowest in nearly 54 years; unfilled job openings surged, with over 1.6 for every unemployed job seeker.
- Inflation roared back to the highest level in over 40 years, then slowed markedly. In all, consumer prices are up nearly 15.7%. Gasoline is up 51.2%.
- Weekly earnings rose briskly, by 12.2%. But after adjusting for inflation, “real” weekly earnings went down 3.4%.
- The S&P 500 has increased 20.2%
- The percentage of Americans without health insurance has gone down by 1.3 percentage points.
- Consumer confidence is 6.4 points lower, according to a University of Michigan index, but it has gone up for two straight months.
- The number of apprehensions of those trying to cross the southern border illegally dropped dramatically in June, but is still up 310%.
- U.S. crude oil production has increased 8.2%; imports are up 7.3%.
- The trade deficit for goods and services climbed 30.1%.
- Debt held by the public has gone up 18.9%.
- Refugee admissions have increased 38.5%, but that’s 2,556 refugees per month on average — far short of Biden’s campaign goal of admitting 125,000 a year.
Analysis
We started “Biden’s Numbers” in January 2022 and have published updates every three months since then on the latest data from authoritative sources on how the U.S. is faring. We ran similar quarterly series for former Presidents Barack Obama and Donald Trump.
Readers can form their own opinions on whether a president deserves credit or blame for these statistics — and how much. We take no position on that.
The starting point for these measurements matters. Biden has boasted of inflation dropping and wages rising faster than prices — and that has happened in recent months. But we start the clock when Biden took office.
Jobs and Unemployment
The number of people with jobs has increased dramatically since Biden took office, far surpassing pre-pandemic levels.
Employment — The U.S. economy added 13,235,000 jobs between Biden’s inauguration and June, the latest month for which data are available from the Bureau of Labor Statistics. The June figure is 3,833,000 higher than the February 2020 peak of employment before COVID-19 forced massive shutdowns and layoffs.
One major category of jobs is still lagging, however. Government employment is still 161,000 jobs short of the pre-pandemic peak. That includes 95,500 fewer public school teachers and other local education workers.
Unemployment — The unemployment rate fell from 6.3% at the time Biden took office to 3.4% in January and again in April, the lowest since June 1969. Most recently the rate has crept up to 3.6% in June. That’s just 0.1 point above the pre-pandemic rate.
Job Openings — The number of unfilled job openings soared, reaching a record of over 12 million in March of last year, but then declined after the Federal Reserve began a steep series of interest rate increases aimed at cooling the economy to bring down price inflation.
The number of unfilled jobs has slipped down to 9.8 million as of the last business day of May, the most recent month on record. That’s still an increase of over 2.6 million openings — or 37% — during Biden’s time.
In May, there was an average of over 1.6 jobs for every unemployed job seeker. When Biden took office, there were fewer jobs than unemployed job seekers.
The number of job openings in June is set to be released Aug. 1
Labor Force Participation — One reason many job openings go unfilled is that millions of Americans left the workforce during the pandemic and haven’t returned. The labor force participation rate (the percentage of the total population over age 16 that is either employed or actively seeking work) has slowly recovered during Biden’s time, from 61.3% in January 2021 to 62.6% in June.
That still leaves the rate well short of the pre-pandemic level of 63.3% for February 2020.
The rate peaked at 67.3% more than two decades ago, during the first four months of 2000. Labor Department economists project that the rate will trend down to 60.1% in 2031, “primarily because of an aging population.”
Manufacturing Jobs — During the presidential campaign, Biden promised he had a plan to create a million new manufacturing jobs — and whether it’s his doing or not, the number is rising briskly.
As of June, the U.S. added 793,000 manufacturing jobs during Biden’s time, a 6.5% increase in the space of 29 months, according to BLS. Furthermore, the June total is 204,000 or 1.6% above the number of manufacturing jobs in February 2020, before the pandemic forced plant closures and layoffs.
During Trump’s four years, the economy lost 170,000 manufacturing jobs, or 1.4%, largely due to the pandemic.
Wages and Inflation
CPI — Inflation came roaring back under Biden, then slowed in recent months.
Overall during his first 29 months in office, the Consumer Price Index rose 15.7%.
It was for a time the worst inflation in decades. The 12 months ending in June of last year saw a 9.1% increase in the CPI (before seasonal adjustment), which the Bureau of Labor Statistics said was the biggest such increase since the 12 months ending in November 1981.
But now inflation is trending down. The CPI rose 3.1% in the 12 months ending June of this year and 0.2% in June itself.
Gasoline Prices — The price of gasoline has gyrated wildly under Biden.
During the first year and a half of his administration, the national average price of regular gasoline at the pump soared to a record high of just over $5 per gallon (in the week ending June 13, 2022), propelled by motorists resuming travel after pandemic lockdowns and then by Russia’s invasion of Ukraine on Feb. 24, 2022.
But then the price drifted down to a low of $3.09 the week ending Dec. 26, 2022, crept back up to $3.66 for the last two weeks in April, and then sank to $3.60 in the week ending July 24, the most recent on record.
That’s $1.22 higher than in the week before Biden took office, an increase of 51.2%.
Wages — Wages also have gone up under Biden, but not as fast as prices.
Average weekly earnings for rank-and-file workers went up 12.2% during Biden’s first 29 months in office, according to monthly figures compiled by the BLS. Those production and nonsupervisory workers make up 81% of all employees in the private sector.
But inflation ate up all that gain and more. “Real” weekly earnings, which are adjusted for inflation and measured in dollars valued at their average level in 1982-84, actually declined 3.4% since Biden took office.
That’s despite a recent upturn as inflation has moderated. Since hitting the low point under Biden in June of last year, real earnings have gone up nearly 1.3%.
Economic Growth
Despite rising interest rates and fears of a recession, the U.S. real (inflation-adjusted) gross domestic product grew at a rate of 2.1% in 2022.
The growth has continued in 2023. In a July 27 release, the Bureau of Economic Analysis estimated that the economy increased at an annual rate of 2.4% in the second quarter. The increase was 2% in the first quarter.
But concerns about a recession remain.
Wells Fargo Investment Institute in a midyear economic outlook report released in June projected real GDP growth at 1.1% in 2023 and 1.5% in 2024. Wells Fargo said it expects a recession “during the back half of 2023 and into early 2024” that would continue to tamp down corporate earnings.
In a June 15 release, the Conference Board, a nonpartisan business membership and research organization, estimated “that real GDP growth will slow to 1.0 percent in 2023, and then fall to 0.0 percent in 2024.”
“The Conference Board forecasts that weaknesses emerging in some parts of the economy will intensify and grow more diffuse over the coming months, leading to a recession,” the board said. “This outlook is associated with numerous factors, including, persistent inflation, Federal Reserve hawkishness, dampened bank lending amid the banking crisis, reduced government spending due to the debt ceiling deal, and underlying trends in consumer spending and income, and business investment.”
In a sustained effort to slow inflation, the Federal Reserve has repeatedly raised interest rates since March 2022 — most recently on July 26.
Not all economists are predicting a recession. In a June 20 opinion piece for CNN, Mark Zandi, chief economist of Moody’s Analytics, wrote that he is “betting against” the “strong consensus” that a recession is inevitable. “Where is the recession? Each passing month, the consensus looks increasingly off-base,” he wrote. “Yes, the economy will ultimately slump, but odds are fading that a recession is dead ahead.”
Corporate Profits
Under Biden, corporate profits set new records in 2021 and 2022 — but have declined in the last three consecutive quarters.
After-tax corporate profits increased for the seventh consecutive year in 2022, reaching a new high of $2.87 trillion, according to the Bureau of Economic Analysis. The record, though, came despite a decline in growth in the last two quarters of the year. (See line 45.)
The slide continued in the first quarter of this year. After-tax corporate profits in the first quarter were estimated at an annual rate of nearly $2.69 trillion — down from $2.72 trillion in the last quarter of 2022 and $2.89 trillion in the third quarter of 2022, according to the BEA.
In its midyear economic outlook report, Wells Fargo Investment Institute said corporations are already experiencing an “earnings recession” that will last through this year.
“Profits should rebound through 2024, as the economic recovery gradually takes hold, but corporate earnings may not recapture their 2022 peak until early 2025,” the report said.
Even with the recent decline in growth, corporate profits in the first quarter were 21.5% higher than the full-year figure for 2020, the year before Biden took office, as estimated by the BEA.
Consumer Sentiment
Consumer confidence in the economy is beginning to bounce back.
The University of Michigan’s Index of Consumer Sentiment increased for the second straight month in July. The preliminary July index was 72.6 — up from 64.4 in June and 59.2 in May.
The July preliminary number is still 6.4 points lower than it was when Biden took office in January 2021. But it is considerably improved from June 2022, when consumer confidence bottomed out at 50.
“The sharp rise in sentiment was largely attributable to the continued slowdown in inflation along with stability in labor markets,” Joanne Hsu, director of the Surveys of Consumers, said.
Stock Markets
After dropping in 2022, the stock markets have rebounded so far this year.
The S&P 500 stock index and the Dow Jones Industrial Average continued to rise since we last calculated the change in late April. The S&P is now up 20.2% since Biden took office, and the Dow, made up of 30 large corporations, has increased 14.8%, as of the close of the markets on July 26.
The NASDAQ composite index, made up of more than 3,000 companies, was still down at our last update, but its continued growth this year now puts it up just 7% under Biden.
Health Insurance
The percentage of the U.S. population that lacks health insurance has gone down under Biden by 1.3 percentage points. The latest figures from the National Health Interview Survey show that 8.4% were uninsured at the time they were interviewed in 2022, down from 9.7% in 2020.
In raw numbers, 27.6 million people were uninsured in 2022, according to the survey, and 31.6 million were uninsured in 2020.
The NHIS is a program of the Centers for Disease Control and Prevention, and the data collection is performed by the Census Bureau.
As we noted in our last update, it’s possible the uninsured figures will start to go up in 2023, since some Medicaid provisions that were enacted during the coronavirus pandemic are being phased out.
In March 2020, a pandemic relief law increased the federal Medicaid funding sent to states and required states to keep Medicaid recipients continuously enrolled while the COVID-19 public health emergency was in effect. As the Kaiser Family Foundation explains, the Medicaid program is known for “churn” — people losing and then reenrolling in coverage due to changes in income eligibility or not being able to comply with renewal requirements. Continuous enrollment is one reason Medicaid enrollment expanded during the pandemic.
But this requirement ended on March 31, and the enhanced federal funding will slowly phase out through the end of this year. KFF estimates that between 5.3 million and 14.2 million people will be disenrolled during this time, and the Department of Health and Human Services says the number could be as high as 15 million.
Some who lose Medicaid coverage could pick up insurance through other sources, such as the Affordable Care Act exchanges. But KFF says the change in policy could lead to an increase in the number of people who lack health insurance.
Immigration
On May 14, a reporter asked Biden how things were going at the border three days after his administration had allowed Title 42 to expire.
“Much better than you all expected,” Biden said.
Indeed, many immigration experts and Republican critics had warned that ending Title 42 — a public health law the Trump administration invoked early in the pandemic that allowed border officials to immediately return many of those caught trying to enter the country illegally — would result in a surge of illegal immigration.
But so far, that hasn’t happened. In June, the number of people apprehended by U.S. Border Patrol attempting to cross into the country illegally dipped to 99,545, 48% lower than June of last year. That’s also the lowest monthly number since February 2021, shortly after Biden took office.
Immigration experts say policies the Biden administration enacted leading up to the end of Title 42 partly explains that. In early January, Biden unveiled several border enforcement initiatives that included expanding pathways for legal immigration. The administration expanded the “parole” process for Venezuelans to Nicaraguans, Haitians and Cubans, allowing applicants a two-year work permit if they have a sponsor in the U.S. and they pass a background check. It also created a mobile app, CBP One, that allows migrants to make appointments to seek asylum (and penalizes those who do not). And the administration announced it would welcome far more refugees from Latin American and Caribbean countries.
“Interestingly, the spike happened in the days leading up to the end of Title 42,” Colleen Putzel-Kavanaugh, an associate policy analyst at the Migration Policy Institute, told us.
Migrants got the message through word-of-mouth about pending broad policy changes by the Biden administration, Putzel-Kavanaugh said. There is typically a slowing of illegal immigration after such changes, as people wait to see how the new policy plays out, she said. And some of the new policies are the subject of ongoing litigation. On July 25, a federal judge blocked a new administration policy that most migrants would be ineligible for asylum if they passed through another country without seeking protection there first.
The end of Title 42 also resulted in tougher consequences for those attempting to enter the country illegally. Under Title 42, many people were simply turned around at the border, without any legal consequences. That encouraged some to simply try crossing again and again, Putzel-Kavanaugh said. Now, the Biden administration has been increasing expedited removals under Title 8, which stipulates that someone caught trying to cross illegally is barred from legal entry for five years. Those caught attempting to cross illegally multiple times can be charged criminally.
Although the number of people apprehended illegally crossing the border has dipped recently, it still remains historically high under the Biden administration.
Looking at the entirety of Biden’s time in office, and to even out the seasonal changes in border crossings, we compare the most recent 12 months on record with the year prior to him taking office. And for the past 12 months ending in June, the latest figures available, apprehensions totaled 2,084,646, according to U.S. Customs and Border Protection. That’s 310% higher than during Trump’s last year in office.
“Part of it is just a general increase in migration worldwide, especially in the Western Hemisphere,” Putzel-Kavanaugh said.
The pandemic caused devastating economic consequences in some countries, she said, and many have experienced very slow recoveries. There has also been a rise in civil unrest and political violence in some Central and South American countries, which has also encouraged migration to the U.S. and other countries.
Asked on May 14 if he was confident the number of illegal border crossings would continue to go down, Biden said, “My hope is they’ll continue to go down, but we have more — a lot more work to do. And we need some more help from the Congress as well in terms of funding and legislative changes.”
Food Stamps
Since our last update, there was a drop in the number of people in the Supplemental Nutrition Assistance Program, or SNAP, which used to be known as food stamps.
As of April, more than 41.9 million people were receiving food assistance, the lowest monthly enrollment since September. That figure is down about 820,000 people from January, and it’s a decrease of about 0.6%, or 235,276 people, from when Biden became president in January 2021. The figures, which are preliminary, come from Department of Agriculture data published this month.
Under Biden, SNAP enrollment was as low as 40.8 million in August and September 2021. Trump’s lowest month was February 2020, when the program had 36.9 million participants.
Crude Oil Production and Imports
U.S. crude oil production averaged roughly 12.25 million barrels per day during Biden’s most recent 12 months in office (through April), according to Energy Information Administration data released in late June. That was 8.2% higher than the average daily amount of crude oil produced in 2020.
In its Short-Term Energy Outlook for July, the EIA projected that crude oil production would average a record 12.56 million barrels per day in 2023, up just a bit from its projections at the time of our last update.
In January, the EIA said it expected much of the increase in crude oil production to come from output in the Permian Basin, which spans 66 counties in southeastern New Mexico and western Texas. In a July update, the EIA said production in the Permian region had increased to 5.7 million barrels per day in March – up from an average of 5.3 million barrels per day in 2022 and 4.7 million barrels per day in 2021.
Greater crude oil production has not translated to fewer crude oil imports, which continued to increase — averaging more than 6.3 million barrels per day in Biden’s last 12 months. That’s up 7.3% from average daily imports in 2020.
Carbon Emissions
There was a small decline in U.S. carbon emissions since our last update.
In the most recent 12 months on record (ending in April), there were almost 4.88 billion metric tons of emissions from the consumption of coal, natural gas and various petroleum products, according to the EIA. That’s nearly 6.6% higher than the 4.58 billion metric tons that were emitted in 2020.
As of this month, the EIA forecast that energy-related emissions will drop to 4.79 billion metric tons for 2023 — spurred by a 20% reduction in coal emissions compared with 2022.
Debt and Deficits
Debt — Since our last quarterly update, the public debt, which excludes money the government owes itself, increased by $1.1 trillion to over $25.7 trillion, as of July 25. That brings the total increase during Biden’s presidency to roughly $4.09 trillion, which is 18.9% higher than it was when Biden took office.
Deficits — Through the first nine months of fiscal year 2023, the federal budget deficit was $1.4 trillion — up $875 billion from the same period in fiscal 2022, according to the Congressional Budget Office’s latest monthly budget review.
As of May, the CBO projected that the FY 2023 deficit would total $1.5 trillion – up about $100 billion from the agency’s forecast in February. The estimated increase is due to the government’s revenue collections through April, which were lower than expected.
However, CBO said its latest projection for the 2023 deficit was “subject to considerable uncertainty,” partly because the Supreme Court had struck down the Biden administration’s initial plan to forgive student loan debt for millions of people. Canceling that plan is expected to result in $300 billion in savings this fiscal cycle, CBO said.
Gun Sales
The National Shooting Sports Foundation’s latest estimates indicate that gun purchases declined again during the second quarter of 2023.
Since the federal government doesn’t collect data on gun sales, the NSSF, a gun industry trade group, estimates gun sales by tracking the number of background checks for firearm sales based on the FBI’s National Instant Background Check System, or NICS. The NSSF-adjusted figures exclude background checks unrelated to sales, such as those required for concealed-carry permits.
The group’s adjusted NICS total for background checks during the second quarter of the year was 3.65 million. That’s a 6.7% drop from the almost 3.92 million in the second quarter of 2022, and it’s also down 35% from the roughly 5.63 million in Trump’s last full quarter in 2020.
Through the first six months of 2023, there were 7.82 million background checks for firearm sales. That half-year total is down from the same period in 2020 (24%), 2021 (20%) and 2022 (3.7%) — which were the years with the first, second and third highest annual totals, respectively.
Trade Deficit
The international trade deficit – while trending down from last year’s record high – is still up compared with Trump’s final year.
Bureau of Economic Analysis figures published this month show the U.S. imported about $849.5 billion more in goods and services than it exported over the last 12 months through May. That’s an increase of more than $196.6 billion, or 30.1%, compared with 2020.
But through the first five months of 2023, the trade gap in goods and services was down $101.7 billion, or 22.8%, from the same period in 2022, the BEA said. Last year’s almost $951.2 billion annual trade deficit was the largest on record going back to 1960.
Judiciary Appointments
Supreme Court — So far under Biden, Justice Ketanji Brown Jackson was confirmed on April 7, 2022, and replaced retired Justice Stephen G. Breyer, an appointee of President Bill Clinton. Trump had won confirmation for two Supreme Court justices at the same point during his term.
Court of Appeals — Under Biden, 36 U.S. Court of Appeals judges have been confirmed, while 43 had been confirmed at the same point of Trump’s tenure.
District Court — For District Court confirmations, 103 judges have been confirmed under Biden. At the same point during Trump’s presidency, 86 nominees had been confirmed.
Three U.S. Court of Federal Claims judges also have been confirmed under Biden; there had been two such judges confirmed at this point under Trump.
As of July 26, there were 69 federal court vacancies, with 27 nominees pending.
Home Prices & Homeownership
Home prices — The median sales price of existing single-family homes in the U.S. was $416,000 in June, the second-highest price ever recorded for a month since the National Association of Realtors began tracking the statistic in 1999.
The highest median price, $420,900, was recorded in June of last year. Since then, prices steadily dropped to $365,400 in January, but have been rising every month since.
The Federal Reserve has steadily been raising interest rates since March 2022 in an attempt to slow inflation, and the average 30-year fixed mortgage rate has increased commensurately. While that has cooled homes sales — the annual rate of existing home sales has dropped nearly 19% year-over-year — prices have been on the rise through the first half of 2023 due to limited inventory.
“There are simply not enough homes for sale,” NAR Chief Economist Lawrence Yun said in a press release announcing the updated June data. “Limited supply is still leading to multiple-offer situations, with one-third of homes getting sold above the list price in the latest month.”
After a swing in prices over the last year, the June median price was 35.1% higher than the price in January 2021, when Biden took office.
Homeownership — Nearly 9 in 10 Americans consider “owning a home … an important factor in the ‘good life’ or the life they would like to have,” according to a recent survey by Fannie Mae’s Economic & Strategic Research Group.
Yet, homeownership rates have remained stubbornly unchanged under Biden.
The homeownership rate, which the Census Bureau measures as the percentage of “occupied housing units that are owner-occupied,” was 66.0% in the first quarter of 2023 — not much higher than the 65.8% rate during Trump’s last quarter in office. (Usual word of caution: The bureau warns against making comparisons with the fourth quarter of 2020, because of pandemic-related restrictions on in-person data collection.)
The rate peaked under Trump in the second quarter of 2020 at 67.9%. The highest homeownership rate on record was 69.2% in 2004, when George W. Bush was president.
Refugees
Biden still remains far from fulfilling his ambitious campaign goal of accepting up to 125,000 refugees a year, although admissions have substantially increased in recent months.
As president, Biden set the cap on refugee admissions for fiscal year 2023 at 125,000 – just as he did in fiscal year 2022. To achieve that goal, the Biden administration would have to admit an average of 10,417 refugees per month.
However, in fiscal year 2022, the administration accepted only 25,465 refugees, or 2,122 per month, according to State Department data. The number of refugees admitted so far this fiscal year already exceeds last year’s total — but it is still well off the pace needed to reach 125,000.
In the first nine months of fiscal year 2023, which began Oct. 1, the administration welcomed 38,653 refugees, or 4,295 per month. Most of those admissions occurred in the last three months. (See “Refugee Admissions Report as of June 30, 2023” for monthly data since fiscal year 2001.)
Overall, the U.S. has admitted 74,126 refugees in Biden’s first full 29 months in office, or 2,556 refugees per month, the data show. That’s about 38.5% higher than the 1,845 monthly average under Trump, who significantly reduced the admission of refugees. (For both presidents, the averages include only full months in office, excluding January in 2017 and 2021, when administrations overlapped.)
In its report to Congress for fiscal year 2023, the State Department said it was making “progress towards fulfilling President Biden’s ambitious admissions target.” That’s true. The 38,653 refugees in the first nine months of fiscal year 2023 is already higher than any fiscal year total since 2017, which spanned the end of President Barack Obama’s second term and the beginning of Trump’s tenure.
Obama set the cap on refugee admissions at 110,000 for FY 2017, but the number of admissions slowed after Trump took office. That year, the U.S. admitted 53,716 refugees — which the Biden administration could reach or exceed by the end of this fiscal year on Sept. 30.
But the Biden administration isn’t likely this fiscal year to reach 125,000 — which is a high bar for any administration. The U.S. has not admitted 125,000 or more refugees since FY 1981, when the U.S. welcomed more than 159,000 refugees, according to the Migration Policy Institute.
Crime
The latest figures from the Major Cities Chiefs Association show the number of murders has continued to decline in 70 large U.S. cities after two years of increases from 2019 to 2021. Murders declined by 7.7% in the first three months of 2023 compared with the same time period in 2022.
The Major Cities Chiefs Association reports found a sizable 33.4% jump in the number of murders in large cities from 2019 to 2020, before Biden took office, and a 6.2% rise in Biden’s first year as president, from 2020 to 2021. But as we reported in the last Biden’s Numbers, there was a drop in murders last year of 5.1%.
AH Datalytics, an independent criminal justice data analysis group, also has found a drop in murders in 2023 compared with 2022, according to publicly available data from 105 U.S. cities. The decline was 11.5% as of July 27, with most cities reporting figures through at least late June.
We won’t have the FBI’s annual report on nationwide crime figures for 2022 until sometime this fall. In its latest report, the FBI estimated that “violent and property crime remained consistent between 2020 and 2021.”
Clarification, July 28: Our chart mistakenly included a plus sign next to the change in food stamp recipients, along with a down arrow. As the story explained, the number of food stamp recipients has gone down. We adjusted the chart accordingly.
Editor’s note: FactCheck.org does not accept advertising. We rely on grants and individual donations from people like you. Please consider a donation. Credit card donations may be made through our “Donate” page. If you prefer to give by check, send to: FactCheck.org, Annenberg Public Policy Center, P.O. Box 58100, Philadelphia, PA 19102.
Sources
U.S. Bureau of Labor Statistics. “Employment, Hours, and Earnings from the Current Employment Statistics survey (National): Total Nonfarm.” Accessed 19 Jul 2023.
U.S. Bureau of Labor Statistics. “Labor Force Statistics from the Current Population Survey: Unemployment.” Accessed 19 Jul 2023.
U.S. Bureau of Labor Statistics. “Job Openings and Labor Turnover Survey: Job Openings.” Accessed 19 Jul 2023.
U.S. Bureau of Labor Statistics. “Labor Force Statistics from the Current Population Survey: Labor Force Participation Rate.” Accessed 19 Jul 2023.
U.S. Bureau of Labor Statistics. Monthly Labor Review. “Projections overview and highlights, 2021–31” Nov 2022.
U.S. Bureau of Labor Statistics. “Employment, Hours, and Earnings from the Current Employment Statistics survey (National): Manufacturing.” Accessed 19 Jul 2023.
U.S. Bureau of Labor Statistics. “Consumer Price Index – All Urban Consumers (Seasonally Adjusted).” Data extracted 19 Jul 2023.
U.S. Bureau of Labor Statistics. Consumer Price Index Summary. News release. 13 Jul 2022.
U.S. Bureau of Labor Statistics, “Gasoline (all types) in U.S. city average, all urban consumers, seasonally adjusted.” Data extracted 19 Jul 2023.
U.S. Energy Information Administration. “Weekly U.S. Regular All Formulations Retail Gasoline Prices.” Data extracted 17 Jul 2023.
Bureau of Labor Statistics. “Employment, Hours and Earnings from the Current Employment Statistics survey (National); Average Weekly Earnings of Production and Nonsupervisory Employees, total private.” Data extracted 19 Jul 2023.
Bureau of Labor Statistics. “Employment, Hours and Earnings from the Current Employment Statistics survey (National); Average Weekly Earnings of Production and Nonsupervisory Employees, 1982-1984 dollars, total private.” Data extracted 19 Jul 2023.
U.S. Bureau of Economic Analysis. “Table 1.1.1. Percent Change From Preceding Period in Real Gross Domestic Product.” Accessed 20 Jul 2023.
U.S. Bureau of Economic Analysis. “Gross Domestic Product, Second Quarter 2023 (Advance Estimate).” 27 Jul 2023.
Wells Fargo Investment Institute. “2023 Midyear Outlook: Navigating End-of-Cycle turbulence.” Jun 2023.
The Conference Board. “About Us.” Accessed 20 Jul 2023.
The Conference Board. “Economic Forecast for the US Economy.” 15 Jun 2023.
Board of Governors of the Federal Reserve System. “Federal Reserve issues FOMC statement.” 26 Jul 2023.
Board of Governors of the Federal Reserve System. “Federal Reserve issues FOMC statement.” 14 Jun 2023.
Zandi, Mark. “Why I’m betting against a US recession.” CNN. 20 Jun 2023.
U.S. Bureau of Economic Analysis. “Table 1.12 National Income by Type of Income.” Accessed 20 Jul 2023.
U.S. Bureau of Economic Analysis. “Table 1.12 National Income by Type of Income: Seasonally Adjusted at annual rates.” Accessed 20 Jul 2023.
Tillmann, Kevin, and Steve Deggendorf. “Consumers’ Homeownership Aspirations Remain High Despite Higher Home Prices and Interest Rates.” Fannie Mae’s Economic & Strategic Research Group. 6 Jun 2023.
US Census Bureau. “Business and Industry: Homeownership rates.” Accessed 7 Jul 2023.
Mateyka, Peter, and Mazur, Christopher. “Homeownership in the United States: 2005 to 2019.” US Census Bureau. Mar 2021.
“The Biden Plan For Securing Our Values as a Nation of Immigrants.” Biden campaign. Accessed 5 Jan 2022.
White House. “Memorandum on Presidential Determination on Refugee Admissions for Fiscal Year 2023.” 27 Sep 2022.
State Department. “Refugee Admissions Report as of June 30, 2023.” Accessed 20 Jul 2023.
State Department. “Report to Congress on Proposed Refugee Admissions for Fiscal Year 2023.” 8 Sep 2022.
The Obama Administration White House. “Presidential Determination — Refugee Admissions for Fiscal Year 2017.” 28 Sep 2016.
Migration Policy Institute. “U.S. Annual Refugee Resettlement Ceilings and Number of Refugees Admitted, 1980-Present.” Accessed 20 Jul 2023.
University of Michigan Surveys of Consumers. Preliminary Results for July 2023. Accessed 14 Jul 2023.
University of Michigan Surveys of Consumers. Preliminary Results for June 2023. Accessed 20 Jul 2023.
Dealer Wire. “NSSF-Adjusted NICS Background Checks for April 2023.” 12 May 2023
Dealer Wire. “NSSF-Adjusted NICS Background Checks for May 2023.” 9 Jun 2023.
Dealer Wire. “NSSF-Adjusted NICS Background Checks for June 2023.” 7 Jul 2023.
U.S. Department of Agriculture. Supplemental Nutrition Assistance Program. Persons, Households, Benefits, and Average Monthly Benefit per Person & Household. 14 Jul 2023, accessed 24 Jul 2023.
U.S. Bureau of Economic Analysis. U.S. Trade in Goods and Services, 1960-present. 6 Jul 2023, accessed 24 Jul 2023.
U.S. Bureau of Economic Analysis. “U.S. International Trade in Goods and Services, May 2023.” 6 Jul 2023.
U.S. Energy Information Administration. U.S. Field Production of Crude Oil. Accessed 24 Jul 2023.
U.S. Energy Information Administration. U.S. Imports of Crude Oil. Accessed 24 Jul 2023.
U.S. Energy Information Administration. “U.S. crude oil production will increase to new records in 2023 and 2024.” 25 Jan 2023.
U.S. Energy Information Administration. “Two counties in New Mexico account for 29% of Permian Basin crude oil production.” 6 Jul 2023.
U.S. Energy Information Administration. “Monthly Energy Review, Jul 2023.” Table 11.1 Carbon Dioxide Emissions From Energy Consumption by Source. 26 Jul 2023.
U.S. Energy Information Administration. “Short-Term Energy Outlook, July 2023.” 11 Jul 2023.
Congressional Budget Office. “Monthly Budget Review: June 2023.” 11 Jul 2023.
Congressional Budget Office. “An Update to the Budget Outlook: 2023 to 2033.” 12 May 2023.
U.S. Department of Treasury. Debt to the Penny. Accessed 26 Jul 2023.
Centers for Disease Control and Prevention; National Health Interview Survey. “Health Insurance Coverage: Early Release of Estimates From the National Health Interview Survey, 2022.” May 2023.
Tolbert, Jennifer and Meghana Ammula. “10 Things to Know About the Unwinding of the Medicaid Continuous Enrollment Provision.” Kaiser Family Foundation. 5 Apr 2023.
Williams, Elizabeth et al. “Fiscal and Enrollment Implications of Medicaid Continuous Coverage Requirement During and After the PHE Ends.” Kaiser Family Foundation. 10 May 2022.
Department of Health and Human Services, Assistant Secretary for Planning and Evaluation. “Unwinding the Medicaid Continuous Enrollment Provision: Projected Enrollment Effects and Policy Approaches.” 19 Aug 2022.
Major Cities Chiefs Association. Violent Crime Survey – National Totals, First Quarter Comparison January 1 to March 31, 2023, and 2022. 15 May 2023.
Major Cities Chiefs Association. Violent Crime Survey – National Totals. Year End Comparison January 1 to December 31, 2022, and 2021. 10 Feb 2022.
Major Cities Chiefs Association. Violent Crime Survey – National Totals. Year End Comparison January 1 to December 31, 2021, and 2020. 10 Feb 2022.
Major Cities Chiefs Association. Violent Crime Survey – National Totals. Year End Comparison January 1 to December 31, 2020, and 2019. updated 14 Feb 2022.
YTD Murder Comparison. AH Datalytics. accessed 27 Jul 2023.
FBI. “FBI Releases 2021 Crime in the Nation Statistics.” Press release. 5 Oct 2022.
United States Courts. Confirmation Listing, Judicial Confirmations, 118th Congress. updated 26 Apr 2023.
United States Courts. Confirmation Listing, Judicial Confirmations, 118th Congress. updated 24 Jul 2023.
United States Courts. Current Judicial Vacancies, 118th Congress. updated 26 Jul 2023.
United States Courts. Confirmation Listing, Judicial Confirmations for January 2019, 115th Congress. updated 1 Jan 2019.
United States Courts. Confirmation Listing, Judicial Confirmations for May 2019. updated 1 May 2019.
White House website. “Remarks by President Biden in Press Gaggle.” 14 May 2023.
U.S. Customs and Border Protection. Nationwide Enforcement Encounters: Title 8 Enforcement Actions and Title 42 Expulsions 2022. Accessed 25 Jul 2023.
White House website. FACT SHEET: Biden-Harris Administration Announces New Border Enforcement Actions. 5 Jan 2023.
U.S. Customs and Border Protection. CBP One Mobile Application. Accessed 25 Jul 2023.
Rose, Joel. “Illegal border crossings are down. One big reason why is now part of a court fight.” NPR. 19 Jul 2023.
Alvarez, Priscilla. “Federal judge blocks Biden’s controversial asylum policy in a major blow to administration.” CNN. 26 Jul 2023.
U.S. Department of Homeland Security. “DHS Continues to Prepare for End of Title 42; Announces New Border Enforcement Measures and Additional Safe and Orderly Processes.” 5 Jan 2023.
U.S. Customs and Border Protection. Southwest Land Border Encounters. Accessed 26 Jul 2023.
National Association of Realtors. “Sales Price of Existing Single-Family Homes.” Undated, accessed 26 Jul 2023.
National Association of Realtors. “Existing-Home Sales Retreated 3.3% in June; Monthly Median Sales Price Reached Second-Highest Amount Ever.” 20 Jul 2023.
Cox, Jeff. “One year after the first rate hike, the Fed stands at policy crossroads.” CNBC. 16 Mar 2023.
Federal Reserve. 30-Year Fixed Rate Mortgage Average in the United States. Accessed 26 Jul 2023.
National Association of Realtors. “Sales Price of Existing Single-Family Homes.” Undated, accessed 16 Jan 2023.