Summary
In the time Donald Trump has been in the White House:
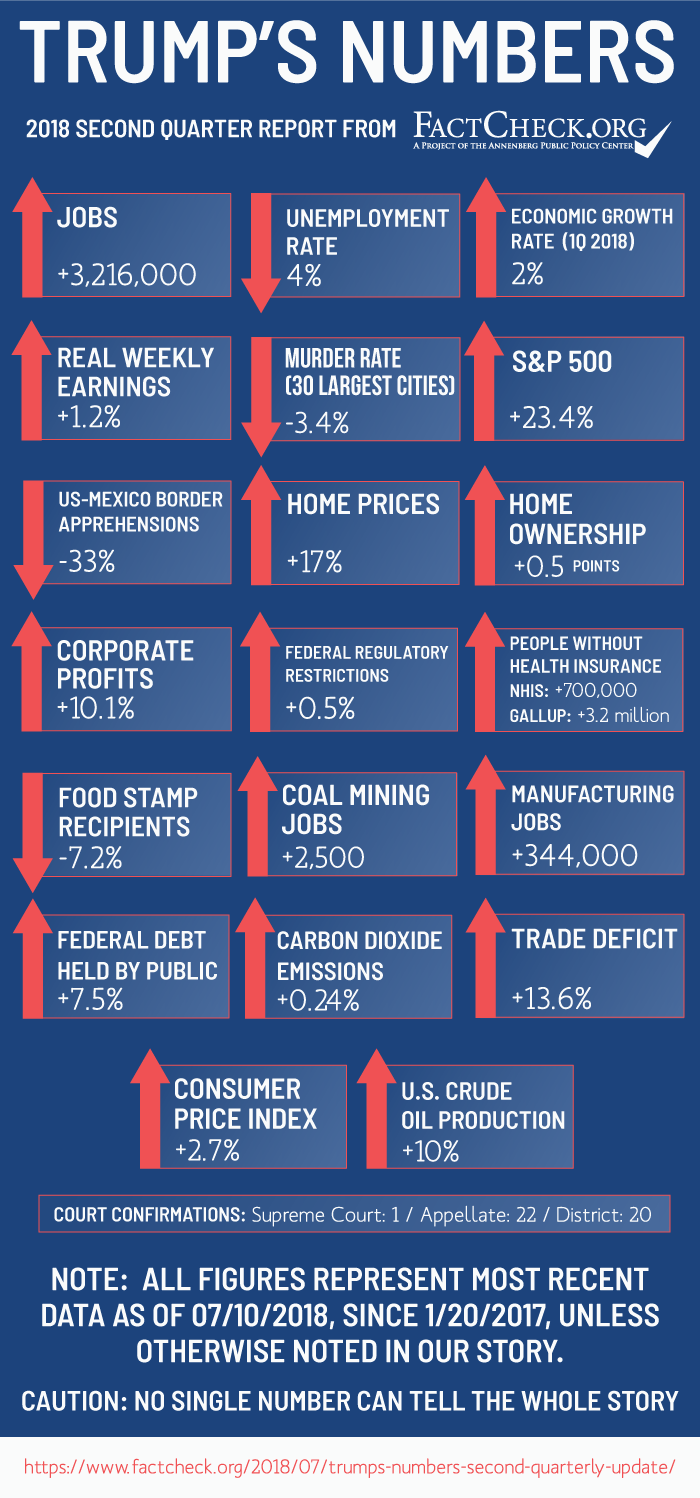
- The economy added 3.2 million jobs, unemployment fell to the lowest level in 18 years, and the number of job openings grew larger than the number of job-seekers for the first time on record.
- Economic growth picked up, but remains below what Trump promised, and even below the best years under Barack Obama.
- The murder rate declined — at least in the 30 largest cities.
- The decade-long downward trend in carbon dioxide emissions from energy slowed — and has most recently turned upward.
- Illegal border crossings from Mexico slowed, but Trump’s promised border wall is still not funded.
- Inflation-adjusted weekly wages rose 1.2 percent.
- Home prices rose 17 percent, to a record level.
- The U.S. trade deficit continued rising — up 13.6 percent.
- The federal debt rose by more than $1 trillion, and projected annual deficits increased.
Analysis
This is our second quarterly update of the “Trump’s Numbers” scorecard that we posted in January and updated for the first time in April. We’ll publish additional updates every three months, as fresh statistics become available.
As always, we’ve included numbers that may seem good or bad or just neutral, depending on the reader’s point of view. And we stress again that opinions differ on how much credit or blame any president deserves for things that happen during his time in office.
And we remind readers that some changes that have happened already during Trump’s time in office haven’t yet shown up in official statistics. FBI crime figures for all of 2017, as well as Census Bureau poverty and household income figures for 2017, won’t be released until later this year. We’ll cover those and more in quarterly updates to come.
Jobs and Unemployment
Employment — Total nonfarm employment grew by more than 3.2 million during the president’s first 17 months in office, according to the most recent figures available from the Bureau of Labor Statistics.
That’s steady, solid growth to be sure, continuing an unbroken chain of monthly gains in total employment that started in October 2010.
But the average monthly gain under Trump is 189,000 jobs, which is nearly 13 percent below the monthly average of 217,000 during Obama’s second term.
Trump will have to pick up the pace if he is to fulfill his campaign boast that he will be “the greatest jobs president that God ever created.” At the current monthly rate, a total of just over 18 million jobs would be added over eight years. That’s better than the 11.6 million added under Obama and the 16.1 million added under Ronald Reagan, but well below the 22.9 million added when Bill Clinton was president, and the population was smaller.
Unemployment — The unemployment rate — which was well below the historical norm when Trump took office — has continued to fall even lower, to the lowest point in 18 years.
The rate was 4.8 percent when he was sworn in, and then fell to 3.8 percent in May — a low not seen since April 2000 — before ticking up to 4.0 percent most recently, in June.
The rate also is well below the historical norm of 5.6 percent, which is the median monthly rate for all the months since the start of 1948. The lowest unemployment rate ever recorded was in 1953, when the rate was 2.5 percent for a couple of months.
Job Openings — Another reason employment growth has slowed is a persistent shortage of workers. The number of unfilled job openings hit a new record of more than 6.8 million in April — the most in the more than 17 years the Bureau of Labor Statistics has been tracking them. In March, for the first time on record, the number of job openings exceeded the number of unemployed people looking for work, which was under 6.6 million.
In May, the number of job openings slipped back to 6.6 million — still the second highest on record and still just over the number of job-seekers. That’s a gain of nearly 1.2 million job openings — a rise of nearly 21.9 percent — since Trump took office.
Labor Force Participation — The labor force participation rate — which went down 2.8 percentage points during the Obama years — has remained essentially unchanged under Trump.
Republicans often criticized Obama for the decline even though it was due mostly to the post-World War II baby boomers reaching retirement age, and other demographic factors beyond the control of any president.
Since Trump took office the rate has fluctuated in a narrow range from 63.0 percent to 62.7 percent. (That’s the portion of the entire civilian population age 16 and older that is either employed or currently looking for work in the last four weeks.) It was 62.9 percent last month, exactly where it was the month Trump took office.
Manufacturing Jobs — Manufacturing jobs increased rapidly under Trump.
The number rose by 344,000 between Trump’s inauguration and June. That followed a net decrease of 192,000 under Obama.
The increase under Trump amounts to 2.8 percent, even faster than the 2.2 percent increase in overall employment.
However, the number of manufacturing jobs is still more than 1 million below where it was in December 2007, at the start of the Great Recession.
Economic Growth
Economic growth rebounded under Trump — but hasn’t reached the rate he promised, and is still below the best years under Obama.
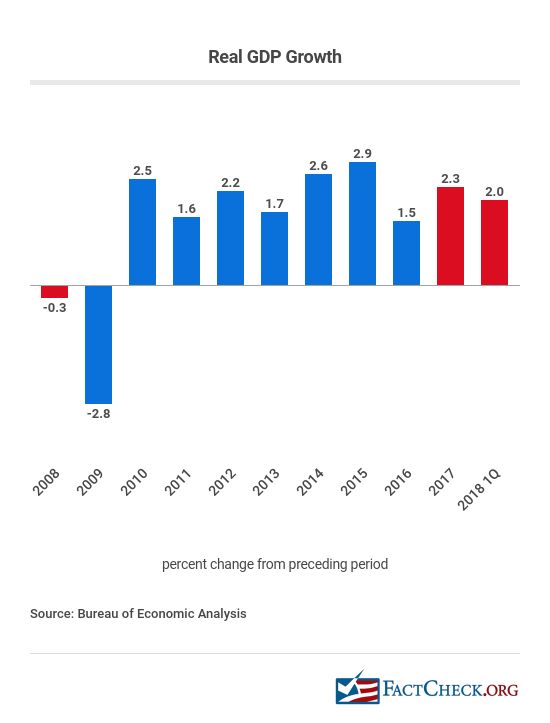
The economy grew at an annual rate of 2.0 percent during the first three months of this year, according to the most recent official estimate by the Bureau of Economic Analysis. That’s the “real” rate of growth in gross domestic product after accounting for price inflation.
The most recent quarter’s growth is down from the 2.3 percent increase during Trump’s first full year, but still better than the 1.5 percent real GDP growth posted in 2016.
But the most recent 2.0 percent rate is lower than the four best years under Obama: 2.9 percent real growth in 2015, 2.6 percent in 2014, 2.2 percent in 2012 and 2.5 percent in 2010.
And it’s far below the annual growth of 4 percent to 6 percent that Trump promised repeatedly, both when he was a candidate and as president.
The first official estimate for the second quarter of 2018 won’t be released until July 27. However, the “GDP Now” forecast produced by the Federal Reserve Bank of Atlanta projected on July 6 that the second-quarter growth rate will come in at 3.8 percent — almost within the range that Trump promised.
But few if any economists expect sustained growth at anywhere close to what Trump has pledged.
The nonpartisan Congressional Budget Office projects real GDP to grow 3.3 percent this year, and 2.4 percent in 2019, then settle to an average of 1.9 percent for decades to come.
The National Association for Business Economists June survey produced a median forecast of 2.8 percent growth this year and 2.5 percent next year.
The most recent median forecast of the Federal Reserve Board members and Federal Reserve Bank presidents, released June 13, is for 2.8 percent in 2018, 2.4 percent in 2019 and 2.0 percent in 2020.
And of the business and university economists who offered an annual GDP forecast to the Wall Street Journal‘s monthly economic survey in June, the average prediction was for 2.9 percent growth this year, 2.4 percent next year and 1.9 percent in 2020.
Regulations
The growth of federal regulation didn’t come to the “sudden, screeching and beautiful halt” Trump once claimed, but it does seem to have ground slowly to a stop over many months — at least for the moment.
The number of restrictive words and phrases (such as “shall,” “prohibited” or “may not”) contained in the Code of Federal Regulations went up by 0.73 percent during Trump’s first 15 months, reaching a peak of nearly 1.09 million on April 6, according to daily tracking done by the QuantGov project at George Mason University’s Mercatus Center.
But since then, the number has declined by 0.21 percent as of July 6. It remains to be seen if that decline is the start of a permanent trend, or just a temporary blip.
Overall, the drop still leaves a 0.5 percent net increase in restrictive words and phrases since Trump took office — a slower rate of rise than in the past. The average annual growth during both the Obama years and the George W. Bush years was just under 1.5 percent, according to annual QuantGov tracking.
The Mercatus Center database provides a hard count of specific legal mandates and prohibitions imposed by federal regulators, which we find to be more relevant than counts of the number of pages or words in the rulebook. It doesn’t attempt to assess the cost or benefit of any particular rule — such assessments require a degree of guesswork and are sensitive to assumptions. But it does track the sheer volume of federal rules with more precision than we have found in other metrics.
At a Dec. 14 event at the White House, Trump said, “We’ve begun the most far-reaching regulatory reform in American history.” A White House fact sheet said that since Trump took office federal agencies had “withdrawn or delayed 1,579 planned regulatory actions.”
Some are quite significant. Within a month of taking office, for example, Trump signed a law nullifying an Obama-era rule prohibiting coal mining companies from dumping waste into streams and waterways.
Crime
The murder rate declined in 2017 — at least in the 30 largest U.S. cities — according to an analysis by the Brennan Center for Justice at the New York University School of Law.
The 30-city murder rate dropped 3.4 percent during Trump’s first year, after rising 13.1 percent in 2016 and 13.2 percent in 2015, the Brennan Center reported.
It’s still not known whether the murder rate for the country as a whole went up or down during 2017. The FBI’s annual Crime in the United States report for 2017 won’t be published for several more weeks. As we reported in our first update, a preliminary FBI report shows that during the first half of 2017 the nationwide number of homicides rose 1.5 percent, compared with the same period a year earlier, even as most other crime declined.
As a candidate, Trump repeatedly claimed that the murder rate was “the highest it’s been in 45 years.” That was wildly untrue. In fact, the murder rate had dropped to the lowest on record in 2014 — 4.4 murders per 100,000 inhabitants. And while it did rise for the next two years, it was still only 5.3 per 100,000 in 2016, lower than where it was the year before Obama took office.
An earlier Brennan analysis found “no evidence of a national crime wave” such as Trump had described. To the contrary, crime rates — both in the largest cities and nationwide — peaked in 1991 and “dropped precipitously in the last quarter-century,” the Brennan Center found.
The center’s most recent and final report of 2017 crime rates in the 30 largest cities found the rate for all crimes fell by 2.1 percent during Trump’s first year, to “remain at historic lows.”
Coal and Environment
Coal Mining Jobs — As a candidate, Trump promised to “put our [coal] miners back to work,” but so far not many have regained their jobs.
A total of 35,700 coal mining jobs disappeared during the Obama years, but as of June only 2,500 of them had come back under Trump, according to BLS figures. That’s just 7 percent of the coal mining jobs lost during the Obama years.
The outlook for coal miners remains bleak. The Energy Information Administration currently projects that U.S. coal production will decline 2 percent this year, and by another 2 percent in 2019. EIA expects there will be less demand for exports, and increased use of natural gas to generate electricity.
Carbon Emissions — Carbon dioxide emissions from energy consumption have started edging up under Trump, after falling for years under Obama.
Revised figures from the Energy Information Administration show CO2 emissions at first fell by 0.9 percent in 2017, less than the 1.6 percent decline in Obama’s final year. They fell by a total of 14.4 percent between 2007 and 2017, due mainly to electric utilities shifting away from coal-fired plants in favor of cheaper, cleaner natural gas, as well as solar and wind power.
But that downward trend that slowed sharply in Trump’s first year has now reversed entirely. Emissions during the most recent 12 months on record, ending in March 2018, were 0.24 percent higher than in all of 2016. And the rise is expected to continue.
EIA predicted in July that CO2 emissions “will increase by 1.8% in 2018.” These projections are sensitive to changes in weather, economic growth and energy prices — all difficult to forecast.
Border Security
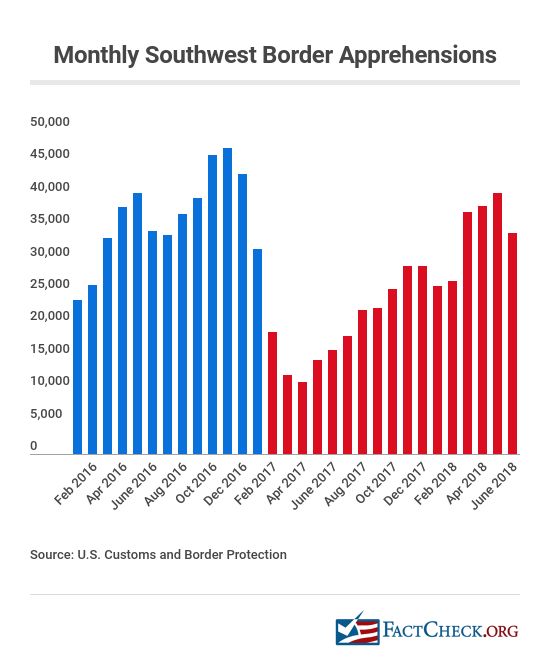
Illegal border crossings declined under Trump, dropping sharply at first but lately rising again.
The number of people caught while illegally trying to cross the U.S. border with Mexico each month plunged to a low of 11,127 in April of last year, according to figures released by U.S. Customs and Border Protection. But since then the number has more than tripled, hitting 40,338 in May before dropping to 34,114 in June.
Despite the recent surge, the monthly average during the first 17 full months of Trump’s tenure is still under 25,000. That’s a drop of 33 percent from the monthly average in 2016, the year before he took office (and 28 percent lower than the monthly average for all the months Barack Obama was in office).
Nevertheless, Trump imposed a “zero tolerance” crackdown at the border that resulted in nearly 3,000 immigrant children being separated from their parents, causing widespread public protests, after which Trump backed down and signed an executive order ending the forced separations.
Meanwhile, Trump’s promised border wall is still little more than that — a promise. A bipartisan spending bill that Trump signed in late March included enough money to start building some new barriers and to upgrade existing fencing and walls — but only along about 100 miles of the 2,000-mile border. Trump called that “just a down payment.” But what’s being built isn’t the sort of solid, concrete wall Trump once described during the campaign, and nothing like any of the prototypes that Trump visited in March.
Corporate Profits
Corporate profits rose to a record high of $1.78 trillion in 2017 — and are running even higher so far this year.
Those after-tax profits were 5.5 percent higher than the full-year figure for 2016, as estimated by the Bureau of Economic Analysis (see line 45), and they topped the previous record of $1.74 trillion set in 2014.
The BEA’s most recent estimate, covering the first three months of 2018, shows after-tax profits running at an annual rate of $1.86 trillion — an increase of 10.1 percent over the full-year 2016 figure.
After-tax profits are getting a boost this year from the tax cut Trump signed into law Dec. 22, dropping the top federal tax rate on corporate income to 21 percent, from 35 percent.
Stock Market
Stock prices continued their long rise under Trump, setting record after record. But they’ve since given up some of the gain.
As of the close on July 10, the Standard & Poor’s 500-stock average was within 3 percentage points below the record high set on Jan. 26 — and a solid 23.4 percent higher than it was on the last trading day before Trump’s inauguration.
Other indexes rose even more. The Dow Jones Industrial Average, made up of 30 large corporations, was up 26.3 percent under Trump. And the NASDAQ Composite index, made up of more than 3,000 companies, set another record high as recently as June 20. At the close on July 10 it was 40.1 percent higher than before Trump took office.
The bull market that began in 2009, at the depths of the Great Recession, passed its ninth anniversary in March. It would require a 20 percent drop from the Jan. 26 high to qualify as a bear market.
Wages and Inflation
The upward trend in real wages continued under Trump, even as prices rose a bit faster.
CPI — The Consumer Price Index rose 2.7 percent during Trump’s first 17 months (through May of this year), continuing a long period of historically low inflation.
That’s an average yearly rate of 1.9 percent. The CPI rose an average of 1.8 percent each year of the Obama presidency (measured as the 12-month change ending each January), and an average of 2.4 percent during each of George W. Bush’s years.
Wages — Wage increases continued to outpace inflation, and so the purchasing power of weekly paychecks rose. The average weekly earnings of all private-sector workers, in “real” (inflation-adjusted) terms, rose 1.2 percent during Trump’s first 17 months, after going up 4.0 percent during Obama’s eight years.
Those figures are for all private-sector workers, including managers and supervisors.
For rank-and-file production and nonsupervisory workers (who make up 82 percent of all private-sector workers) real weekly earnings have gone up 1.5 percent so far under Trump, after rising 3.7 percent during Obama’s eight years.
Consumer Sentiment
Consumer confidence in the economy soared after Trump’s election, at one point reaching the highest point in 14 years. It currently stands higher than at any time during the Obama years (up until Trump’s election in November 2016).
The University of Michigan’s Surveys of Consumers reported that its Index of Consumer Sentiment hit 101.4 in March, the highest since January 2004, a month marked by general euphoria following the capture of Saddam Hussein.
The confidence figure has remained high, slipping most recently to 98.2, the final figure for June. That’s still just above the highest point between Obama’s inauguration and Trump’s election, which was 98.1 in January 2015.
The survey’s chief economist, Richard Curtin, said consumers in June still expected “small additional declines in the unemployment rate as well as higher wage gains,” but were concerned about the potential impact of Trump’s tariffs on the domestic economy.
Home Prices and Ownership
Home Prices — Home prices soared to record levels under Trump.
The most recent sales figures from the National Association of Realtors show the national median price of an existing, single-family home sold in May was $267,500, the highest ever recorded.
That’s nearly 17 percent above the median price of $228,700 for homes sold during the month he took office. The rise in the Consumer Price Index during the same period was just under 2.7 percent.
The Realtors figures reflect raw sales prices without attempting to adjust for such factors as variations in the size, location, age or condition of the homes sold in a given month or year. Even so, a similar pattern emerges from the S&P CoreLogic Case-Shiller U.S. National Home Price Index, which compares sales prices of similar homes and seeks to measure changes in the total value of all existing single-family housing stock.
The Case-Shiller index for April sales also was a record high, and 8.7 percent higher than where it stood in the month Trump took office.
Whichever way you measure it, homeowners have seen the value of their houses rise dramatically since Trump took office.
Homeownership — Meanwhile the percentage of Americans who own their homes has continued to recover from a years-long slide, gaining 0.5 percentage points since Trump took office.
The homeownership rate peaked at 69.2 percent of households for two quarters in 2004. Then in the second quarter of 2016 it hit bottom at 62.9 percent — the lowest point in more than half a century, and tied for the lowest on record.
The rate recovered 0.8 points before Trump took office, and has continued rising to 64.2 percent in the last quarter of 2017 and again in the first quarter of 2018, according to the most recent Census Bureau figures.
Trade
The trade deficit that Trump promised to reduce grew larger instead.
The most recent government figures show that the total U.S. trade deficit in goods and services during the most recent 12 months on record, ending in May, was just over $570 billion. That’s nearly 13.6 percent larger than in 2016.
That increase came despite a 6.6 percent one-month drop in May, to the lowest monthly deficit since October 2016, before Trump was elected. But this drop may well prove to be temporary, as it was driven by a surge in exports led by soybeans and commercial aircraft. Exporters may have been rushing to beat the punitive tariffs (import taxes) that China had promised to impose (and later did) in retaliation for Trump’s proposed taxes on what the U.S. buys from China.
China — The goods-and-services trade deficit with China grew at a similar clip, up by 12.9 percent between 2016 and the most recent 12 months on record, ending in March, when it hit $348 billion. (Country-by-country trade figures for goods and services are available only on a quarterly basis).
Since the period covered by those figures, Trump has initiated a full-scale trade conflict with China, threatening to impose taxes on practically everything the U.S. imports from China. The first tariffs took effect at 12:01 a.m. on July 6, prompting China to retaliate with increased tariffs on $34 billion in U.S. goods. There is as yet no negotiated solution in sight.
Mexico — Meanwhile, the much smaller trade deficit in goods and services with Mexico totaled nearly $70 billion the 12 months ending in March, an increase of 12.0 percent compared with 2016.
Trump’s negotiations to alter the North American Free Trade Agreement with Mexico and Canada were bogged down for all of 2017 and still have not resulted in a new agreement. And in the July 1 election, a populist, anti-Trump candidate was elected as Mexico’s new president in a landslide victory, further muddling the outlook for renegotiating the trade pact. Andrés Manuel López Obrador takes office Dec. 1.
Canada — Meanwhile, the trade surplus that the U.S. runs with Canada grew just a bit smaller under Trump. The trade balance was positive by nearly $6.9 billion during the 12 months ending in March — meaning that the U.S. sold that much more in goods and services to Canada than it bought from that country. That surplus is 6.9 percent smaller than it was in 2016.
Trump has a hard time with this. In March, he famously told a group of political donors that he told Canadian Prime Minister Justin Trudeau that Trudeau was “wrong” to say the U.S. runs a surplus with Canada, even though U.S. government figures show it does. “I didn’t even know. … I had no idea. I just said, ‘You’re wrong,'” Trump said, according to audio of his remarks.
Health Insurance Coverage
The number of people lacking health insurance went up only somewhat, but millions are expected to drop or lose coverage next year and in subsequent years.
The most recent report from the National Health Interview Survey estimates that 29.3 million people were uninsured during 2017. That’s an increase of 700,000 people from 2016. But it’s still 19.3 million fewer than were uninsured in 2010, the year Obama signed the Affordable Care Act.
However, polling by the Gallup organization found a larger increase — estimating that 3.2 million Americans entered the ranks of the uninsured in 2017.
Trump failed to “repeal and replace” the Affordable Care Act as he promised to do. But in December, he signed a tax bill that will end Obamacare’s tax penalty for people who fail to obtain coverage. At that point, Trump told reporters that “Obamacare is finished. It’s dead. It’s gone.” But that’s not so; the mandate penalty remains in effect until 2019.
Trump notwithstanding, the number of people signing up in December through the ACA exchanges for coverage in 2018 dropped only slightly, to 11.8 million. That’s down from 12.2 million in 2017 and 12.7 million in 2016, according to the government’s final enrollment report released April 3.
The big impact is expected later. According to an estimate by the nonpartisan Congressional Budget Office, the end of the mandate penalty next year will cause 4 million people to lose or drop coverage in 2019, rising to 12 million two years later and 13 million in 2025.
CBO said that ending the mandate would cause average policy premiums for those buying individual policies to rise 10 percent in most years. “[H]ealthier people would be less likely to obtain insurance and … the resulting increases in premiums would cause more people to not purchase insurance,” CBO said.
Food Stamps
The number of food stamp recipients went down under Trump — even as he proposed to cut the program and to move it to a newly named “Department of Health and Public Welfare.”
As of April, the most recent month for which figures are available, 39.6 million people were receiving the aid, the lowest number since February 2010. The number has gone down nearly 3.1 million, or 7.2 percent, since January 2017, when Trump took office.
The number generally has been going down since peaking at nearly 47.8 million in December 2012, as the economy recovered from the Great Recession of 2007-2009. The numbers jumped up in August, September and October last year as part of the federal government’s disaster relief efforts following Hurricanes Harvey, Irma and Maria and after wildfires in eight Western states. But that increase proved to be a temporary blip in the downward trend.
Judiciary Appointments
Trump is putting his mark on the federal appellate courts more quickly than Obama was able to do in his first months. But Obama won confirmation of more lower court judges.
Supreme Court — So far Trump has won Senate confirmation for one Supreme Court nominee, Justice Neil Gorsuch. Obama also was able to fill one high court vacancy during his first year-and-a-half in office, with Justice Sonia Sotomayor.
Trump now has an opportunity to fill a second vacancy on the high court. Justice Anthony Kennedy is retiring effective July 31, and Trump has announced his intent to nominate Judge Brett M. Kavanaugh of the U.S. Court of Appeals for the District of Columbia Circuit to fill that vacancy.
Should Kavanaugh win quick confirmation that would keep the score numerically even with Obama at two Supreme Court justices each. On Aug. 5 of Obama’s second year in office, 2010, the Senate approved his nomination of Elena Kagan to be a Supreme Court justice.
Court of Appeals — But Trump has won confirmation for 22 U.S. Court of Appeals judges, including the most recent one cleared by the Senate July 10. That total compares with only nine for Obama at the same point in his first term.
USA Today called his early success “perhaps Trump’s most significant achievement” to date. However, responsibility must be shared with the Republican leadership of the Senate, which not only refused to consider Obama’s appointment of Merrick Garland to fill the Supreme Court vacancy eventually filled by Trump’s appointee Gorsuch, but also blocked confirmation of dozens of Obama’s nominees to lower courts as well. Trump inherited 17 Court of Appeals vacancies, for example, including seven that had Obama nominees pending and that expired at the time Trump took office.
District Court — On the other hand, only 20 of Trump’s nominees to be federal District Court judges have been confirmed, which is seven fewer than the 27 for whom Obama had won confirmation at the same point in his presidency.
Federal Debt and Deficits
Trump inherited rising federal debt and deficits, and his tax cut and spending increases are projected to make both rise faster.
The federal debt held by the public stood at nearly $15.5 trillion at the last count on July 9 — more than $1 trillion more than when he took office. That’s a 7.5 percent increase under Trump. And that figure will go up even faster in coming years unless Trump and Congress impose massive spending cuts, or reverse course and increase taxes.
The annual federal deficit for fiscal year 2017 (which ended Sept. 30 and was largely the result of spending and taxes set under Obama) was nearly $666 billion, up from just under $586 billion the year before.
The nonpartisan Congressional Budget Office had expected that deficit to drop a bit in the current year before resuming an indefinite upward path. But Trump’s cuts in corporate and individual income tax rates — as well as the bipartisan spending deal he signed Feb. 9 — stand to cause the red ink to gush even faster.
CBO now estimates that the deficit for the current fiscal year (ending Sept. 30) will rise to $804 billion, and continue rising for the foreseeable future, exceeding $1 trillion annually starting in FY2020. (Deficit projections are in Summary Table 2, page 4.) Further, CBO said June 29 that under current law, federal deficits will continue growing for the next 30 years, “reaching the highest level of debt relative to GDP in the nation’s history by far.” CBO projected debt would reach 152 percent of the nation’s total annual economic output by 2048 — up from 78 percent currently.
CBO’s projections take into account an increase in economic growth expected from Trump’s tax cuts. But the cuts fall well short of paying for themselves.
CBO projected that GDP would be 0.7 percent higher on average each year over the next 11 years as a result of the cuts. That’s enough to reduce the projected $2.3 trillion initial cost of the tax rate reductions (including both lost revenue and higher borrowing costs) by $461 billion — or about one-fifth. (See table B3.)
Oil Production and Imports
U.S. crude oil production resumed its upward trend under Trump, rising 10 percent during the most recent 12 months on record (ending in April), compared with all of 2016.
Domestic oil production has increased every year since 2008, except for a 5.6 percent drop in 2016 after prices plunged to below $30 a barrel, from more than $100 in 2014. The price returned to more than $50 a barrel by the end of 2016 and as high as $74 a barrel this year, prompting increased drilling and production.
As a result, the trend to reduce reliance on foreign oil also resumed. The U.S. imported only 15.5 percent of its oil and petroleum products during the first five months of 2018, down from 24.4 percent in all of 2016.
Dependence on imports peaked in 2005, when the U.S. imported 60.3 percent of its petroleum, and it has declined every year since except for 2016, when it ticked up by 0.3 percentage points.
Sources
Bureau of Labor Statistics. “Employment, Hours, and Earnings from the Current Employment Statistics survey (National); Total Nonfarm Employment, Seasonally Adjusted.” Data extracted 10 Jul 2018.
Bureau of Labor Statistics. “Labor Force Statistics from the Current Population Survey; Unemployment Rate, Seasonally Adjusted.” Data extracted 10 Jul 2018.
Bureau of Labor Statistics. “Job Openings and Labor Turnover Survey: Job Openings, Seasonally Adjusted.” Data extracted 10 Jul 2018.
Bureau of Labor Statistics. “Labor Force Statistics from the Current Population Survey; Labor Force Participation Rate.” Data extracted 10 Jul 2018.
Bureau of Labor Statistics. “Labor Force Statistics from the Current Population Survey; All employees, thousands, manufacturing, seasonally adjusted.” Data extracted 10 Jul 2018.
U.S. Bureau of Economic Analysis. “Gross Domestic Product: First Quarter 2018 (Third Estimate)
Corporate Profits: First Quarter 2018 (Revised Estimate) News release. 28 Jun 2018.
U.S. Bureau of Economic Analysis. “Table 1.1.1. Percent Change From Preceding Period in Real Gross Domestic Product.” Interactive data extracted 10 Jul 2018.
Wall Street Journal. “WSJ Economic Survey June 2018.”
National Association of Business Economists. “NABE Outlook Survey – June 2018.”
McLaughlin, Patrick A. and Oliver Sherouse. 2017. “QuantGov—A Policy Analytics Platform.” Daily Summary tracking of restrictions in the eCFR (Electronic Code of Federal Regulations). Downloaded 10 Jul 2018.
McLaughlin, Patrick A. and Oliver Sherouse. 2017. “QuantGov—A Policy Analytics Platform.” “RegData 3.0 Restrictions by Year.” Downloaded 10 Jul 2018.
Grawert, Ames and James Cullen and Vienna Thompkins. “Crime in 2017: Final Analysis.” Brennan Center for Justice at New York University School of Law. 12 Jun 2018
Federal Bureau of Investigation. “Crime in the United States 2017; January-June, Preliminary Semiannual Uniform Crime Report.” Table 1. 23 Jan 2018.
Bureau of Labor Statistics. “Labor Force Statistics from the Current Population Survey; All employees, thousands, coal mining, seasonally adjusted.” Data extracted. 10 Jul 2018.
U.S. Energy Information Administration. Short Term Energy Outlook. 10 Jul 2018.
U.S. Border Patrol. “U.S. Border Patrol Apprehensions FY2018 YTD (October 1 – June 30)” Undated. Accessed 10 Jul 2018.
U.S. Border Patrol. “Total Illegal Alien Apprehensions By Month Fiscal Years 2000-2017.” Undated. Accessed 110 Jul 2018.
U.S. Bureau of Economic Analysis. “Corporate Profits After Tax (without IVA and CCAdj)” (NIPA Table 1.12, line 45) 28 Jun 2018.
Yahoo! Finance. “Dow Jones Industrial Average.” Accessed 10 Jul 2018.
Yahoo! Finance. “S&P 500.” Accessed 10 Jul 2018.
Yahoo! Finance. “NASDAQ Composite.” Accessed 10 Jul 2018.
Franck, Thomas. “On the bull market’s ninth birthday, here’s how it stacks up against history.” CNBC.com. 8 Mar 2018.
Bureau of Labor Statistics. “Consumer Price Index – All Urban Consumers.” Data extracted 10 Jul 2018.
Bureau of Labor Statistics. “Employment, Hours, and Earnings from the Current Employment Statistics survey (National); Average Weekly Earnings of All Employees, 1982-1984 Dollars.” Data extracted 10 Jul 2018.
Bureau of Labor Statistics. “Employment, Hours, and Earnings from the Current Employment Statistics survey (National); Average Weekly Earnings of production and nonsupervisory employees, 1982-1984 Dollars.” Data extracted 10 Jul 2018.
University of Michigan Surveys of Consumers. “The Index of Consumer Sentiment.” Jul 2018.
National Association of Realtors. “Sales Price of Existing Single-Family Homes.” 20 Jun 2018.
U.S. Census Bureau. “Time Series: Not Seasonally Adjusted Home Ownership Rate.” Data extracted 10 Jul 2018.
U.S. Bureau of Economic Affairs. “U.S. International Trade in Goods and Services, Balance of Payments, Seasonally Adjusted.” monthly data extracted 6 Jul 2018.
U.S. Bureau of Economic Affairs. ”Table 3. U.S. International Trade by Selected Countries and Areas: Balance on Goods and Services.” 6 Jun 2018.
Centers for Disease Control and Prevention; National Health Interview Survey. “Health Insurance Coverage: Early Release of Estimates From the National Health Interview Survey, 2017.” 22 May 2018.
Auter, Jack. “U.S. Uninsured Rate Steady at 12.2% in Fourth Quarter of 2017.” Gallup News. 16 Jan 2018.
U.S. Congress, Congressional Budget Office. “Repealing the Individual Health Insurance Mandate: An Updated Estimate.” 8 Nov 2017.
U.S. Department of Agriculture, Food and Nutrition Service. “Supplemental Nutrition Assistance Program (Data as of June 8 2018).” Data extracted 10 Jul 2018.
U.S. Department of Agriculture, Food and Nutrition Service. Supplemental Nutrition Assistance Program (SNAP) data, fiscal years 1968-2017.
Administrative Office of the U.S. Courts. “Confirmation Listing; Judicial Confirmations; 115th Congress.” web page accessed 10 Jul 2018.
Administrative Office of the U.S. Courts. “Judicial Confirmations for February 2010.” archived web listing of confirmations in 110th Congress accessed 10 Jul 2018.
U.S. Treasury. “The Debt to the Penny and Who Holds It.” Data extracted 10 Jul 2018.
U.S. Treasury. “Final Monthly Treasury Statement of Receipts and Outlays of the United States Government For Fiscal Year 2017 Through September 30, 2017.” 20 Oct 2017.
U.S. Congress, Congressional Budget Office. “The Budget and Economic Outlook: 2018 to 2028.” 9 Apr 2018.
U.S. Energy Information Administration. “U.S. Field Production of Crude Oil.” Data accessed 10 Jul 2018.
U.S. Energy Information Administration. “Weekly Cushing OK WTI Spot Price FOB.” Weekly oil price data, accessed 10 Jul 2018.
U.S. Energy Information Administration. “Table 3.3a Petroleum Trade: Overview.” Monthly Energy Review. 26 June 2018, Accessed 10 Jul 2018.