Summary
Here’s how things have changed in the U.S. so far under President Joe Biden, who announced on April 25 that he is officially running for reelection:
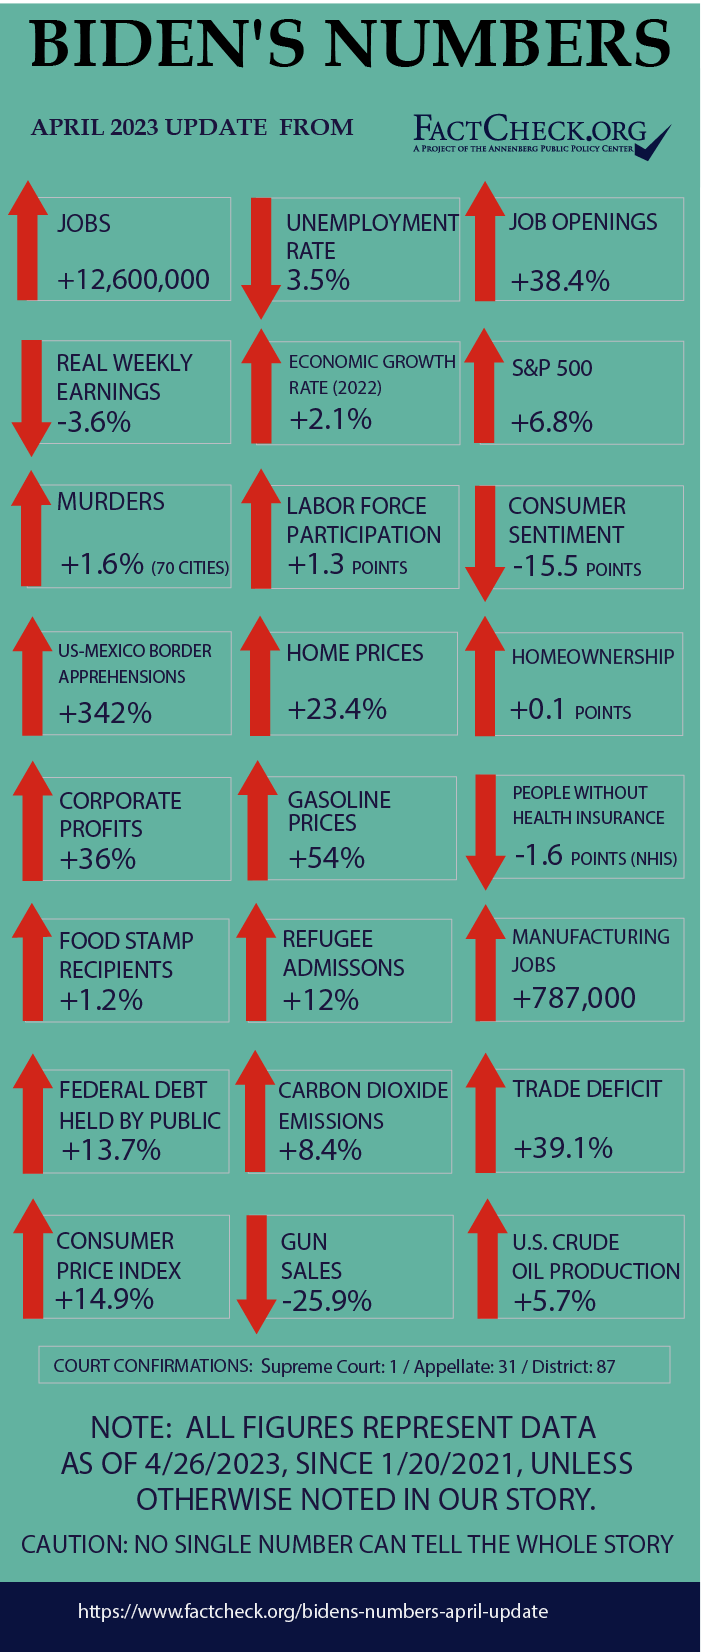
- The economy added 12.6 million jobs under Biden, putting the total 3.2 million higher than before the pandemic.
- The unemployment rate dropped back to 3.5%; unfilled job openings surged, with nearly 1.7 for every unemployed job seeker.
- Inflation roared back to the highest level in over 40 years, then slowed markedly. In all, consumer prices are up nearly 15%. Gasoline is up 54%.
- Weekly earnings rose briskly, by 11.3%. But after adjusting for inflation, “real” weekly earnings went down 3.6%.
- People apprehended for entering the U.S. illegally from Mexico has increased by 342%.
- Domestic crude oil production has increased 5.7%, and crude oil imports are up almost 6.7%.
- The economy grew at 2.1% last year, despite high inflation and concerns about a possible recession.
- The population without health insurance dropped by 1.6 percentage points.
- The number of people receiving federal food assistance has increased by about 1.2%.
- Despite a decline in 2022, the number of murders in 70 large U.S. cities has now gone up by 1.6%.
- The stock markets have underperformed. The S&P 500-stock index is up nearly 7% and the Dow Jones Industrial Average is up almost 8%, while the NASDAQ composite index is down 10.2%.
Analysis
This is our sixth installment of “Biden’s Numbers,” which we started in January 2022 and have updated since then every three months.
As we have done for former Presidents Barack Obama and Donald Trump, we’ve included the latest statistics from the most authoritative sources to provide a sense of how the country is performing. These statistics may or may not reflect the president’s policies. We make no attempt to render any judgments on how much blame or credit a president deserves. Opinions will vary on that.
Our next Biden’s Numbers article will appear in July.
Jobs and Unemployment
The number of people with jobs has increased dramatically since Biden took office, far surpassing pre-pandemic levels.
Employment — The U.S. economy added 12,600,000 jobs between Biden’s inauguration and March, the latest month for which data are available from the Bureau of Labor Statistics. The March figure is 3,198,000 higher than the February 2020 peak of employment before COVID-19 forced massive shutdowns and layoffs.
One major category of jobs is still lagging, however. Government employment is still 314,000 jobs short of the pre-pandemic peak. That includes 130,000 fewer public school teachers and other local education workers.
Unemployment — The unemployment rate fell from 6.3% at the time Biden took office to 3.5% in March — a decline of 2.8 percentage points. The current rate is exactly where it was in the months just before the pandemic.
That’s uncommonly low. Since 1948, when BLS began keeping records, the jobless rate has been at or below 3.5% for only 61 months — including five months during Biden’s time and three months during the Trump years, just before the pandemic. Previously, the rate hadn’t been so low since the 1960s.
Job Openings — The number of unfilled job openings soared, reaching a record of over 12 million in March of last year, but then declined after the Federal Reserve began a steep series of interest rate increases aimed at cooling the economy to bring down price inflation.
The number of unfilled jobs has slipped down to just 9.9 million as of the last business day of February, the most recent month on record. That’s still an increase of over 2.8 million openings — or 38.4% — during Biden’s time.
In February, there was an average of nearly 1.7 jobs for every unemployed job seeker. When Biden took office, there were fewer jobs than unemployed job seekers.
The number of job openings in March is set to be released May 2.
Labor Force Participation — One reason many job openings go unfilled is that millions of Americans left the workforce during the pandemic and haven’t returned. The labor force participation rate (the percentage of the total population over age 16 that is either employed or actively seeking work) has slowly recovered during Biden’s time, from 61.3% in January 2021 to 62.6% in March.
That still leaves the rate well short of the pre-pandemic level of 63.3% for February 2020.
The rate peaked at 67.3% more than two decades ago, during the first four months of 2000. Labor Department economists project that the rate will trend down to 60.1% in 2031, “primarily because of an aging population.”
Manufacturing Jobs — During the presidential campaign, Biden promised he had a plan to create a million new manufacturing jobs — and whether it’s his doing or not, the number is rising briskly.
As of March, the U.S. added 787,000 manufacturing jobs during Biden’s time, a 6.5% increase in the space of 26 months, according to BLS. Furthermore, the March total is 198,000 or 1.5% above the number of manufacturing jobs in February 2020, before the pandemic forced plant closures and layoffs.
During Trump’s four years, the economy lost 182,000 manufacturing jobs, or 1.4%, largely due to the pandemic.
Wages and Inflation
CPI — Inflation came roaring back under Biden but has slowed dramatically in recent months.
Overall, during his first 26 months in office the Consumer Price Index rose 14.9%.
It was for a time the worst inflation in decades. The 12 months ending last June saw a 9.1% increase in the CPI (before seasonal adjustment), which the Bureau of Labor Statistics said was the biggest such increase since the 12 months ending in November 1981.
But now inflation is trending down. The CPI rose 5.0% in the most recent 12 months, 1.8% in the most recent six months and only 0.1% in March.
Gasoline Prices — The price of gasoline has gyrated wildly under Biden.
During the first year and a half of his administration, the national average price of regular gasoline at the pump soared to a record high of just over $5 per gallon (in the week ending last June 13). The rise was propelled first by motorists resuming travel and the commerce surging back after pandemic lockdowns, and then by Russia’s invasion of Ukraine on Feb. 24, 2022, which disrupted oil markets as the West attempted to punish Russia, the world’s third-largest oil producer.
Since then, the price drifted down to a low of $3.09 the week ending Dec. 26, and now has gone up again to $3.66 the week ending April 24, the most recent on record.
That’s $1.28 higher than in the week before Biden took office, an increase of 54%.
Wages — Wages also have gone up under Biden, but not as fast as prices.
Average weekly earnings for rank-and-file workers went up 11.3% during Biden’s first 26 months in office, according to monthly figures compiled by the BLS. Those production and nonsupervisory workers make up 81% of all employees in the private sector.
But inflation ate up all that gain and more. “Real” weekly earnings, which are adjusted for inflation and measured in dollars valued at their average level in 1982-84, actually declined 3.6% since Biden took office.
That’s despite a recent upturn as inflation has moderated. Since June of last year, real earnings have gone up 1.1%.
Economic Growth
Despite two straight quarters of contraction at the beginning of 2022 and fears of a recession, the U.S. economy expanded for the full year in 2022 and continued to grow in the first quarter of 2023.
The U.S. real (inflation-adjusted) gross domestic product increased 2.1% in 2022 — buoyed by stronger-than-expected third and fourth quarters.
In a March 30 release, the Bureau of Economic Analysis estimated that real GDP increased in the third quarter at an annualized rate of 3.2% and in the fourth quarter at a rate of 2.6%.
The growth continued in the first quarter of 2023, but at a slower pace. In its first estimate issued April 27, the BEA said the economy increased at an annual rate of 1.1% in the first quarter.
Still, concerns about a recession remain.
The Conference Board, a nonpartisan business membership and research organization, estimates that the probability of a recession within the next 12 months stands at nearly 99%.
“While US GDP growth defied expectations in late 2022 and early 2023 data has shown unexpected strength, we continue to forecast that GDP growth to contract for three consecutive quarters starting in Q2 2023,” the Conference Board said in an April 12 report on its U.S. recession probability model, citing “the Federal Reserve’s interest rate hikes and tightening monetary policy.”
In a sustained effort to slow inflation, the Federal Reserve has repeatedly raised interest rates — most recently on March 22, when it raised rates for the ninth time in 12 months.
Corporate Profits
Under Biden, corporate profits continued to set new records — although recent quarters haven’t been as strong.
After-tax corporate profits increased for the seventh consecutive year in 2022, reaching a new high of $2.87 trillion, according to the Bureau of Economic Analysis. The record, though, came despite a decline in growth in the last two quarters of the year.
During the third quarter of 2022, corporate profits were estimated at an annual rate of nearly $2.9 trillion — down slightly from the $3 trillion record set in the previous quarter, according to the BEA. That slide continued in the fourth quarter, when profits were running at a yearly rate of $2.7 trillion.
Even with the recent decline in growth, corporate profits were 36% higher than the full-year figure for 2020, the year before Biden took office, as estimated by the BEA. (See line 45.)
Consumer Sentiment
Consumer confidence in the economy remains stubbornly low, even falling a bit since our last report.
The University of Michigan’s Surveys of Consumers reported that its preliminary monthly Index of Consumer Sentiment for April was 63.5. That’s down slightly from our last report – despite a slight easing recently in consumer prices — and 15.5 points lower than it was when Biden took office in January 2021.
“While consumers have noted the easing of inflation among durable goods and cars, they still expect high inflation to persist, at least in the short run,” Joanne Hsu, director of the Surveys of Consumers, said. “On net, consumers did not perceive material changes in the economic environment in April.”
Stock Markets
Under the past two presidents, the stock markets rose sharply. But that hasn’t been the case under Biden.
Since Biden took office, the S&P 500 stock index is up about 6.8% as of the close of the market on April 26.
The Dow Jones Industrial Average, which is made up of 30 large corporations, hasn’t done much better, increasing 7.7%.
And the tech-heavy NASDAQ composite index, made up of more than 3,000 companies, is down 10.2% since Biden took office, despite a surprisingly strong first quarter. Year to date, NASDAQ is up 13.3%.
Health Insurance
The latest figures from the National Health Interview Survey show that 8.7% of the population was uninsured in the third quarter of 2022 at the time they were interviewed. That compares with 10.3% of the population that was uninsured in the fourth quarter of 2020, before Biden took office.
That decrease of 1.6 percentage points is similar to the decrease we noted in our last report comparing all of 2020 to the first six months of 2022. Over that time frame, the number of people without health insurance declined by 4.2 million.
The NHIS is a program of the Centers for Disease Control and Prevention, and the data collection is performed by the Census Bureau in face-to-face interviews.
It’s possible the number, and percentage, of uninsured Americans will start to go up, now that some Medicaid provisions enacted during the coronavirus pandemic are being phased out.
As the Kaiser Family Foundation explains, in March 2020, a pandemic relief law increased the federal Medicaid funding sent to states and required states to keep Medicaid recipients continuously enrolled while the COVID-19 public health emergency was in effect. The Medicaid program is known for “churn,” meaning people lose coverage and reenroll often. This could be due to fluctuations in income that change eligibility or inability to comply with renewal requirements and checks on eligibility.
This continuous enrollment provision was one reason Medicaid enrollment has grown over the last few years, reaching nearly 95 million at the end of March. But this requirement ended on March 31, due to another law Congress passed late last year, and the enhanced federal funding during the pandemic will slowly phase out through the end of this year. KFF estimates that between 5.3 million and 14.2 million people will be disenrolled during this time. The Department of Health and Human Services says the number could be as high as 15 million, 6.8 million of whom would still be eligible for Medicaid.
Some who lose Medicaid coverage could be eligible for subsidized plans on the Affordable Care Act exchanges or other insurance, and the Centers for Medicare & Medicaid Services required states to come up with plans on how they might mitigate loss of insurance during this so-called “unwinding” period. But KFF says the change in policy could lead to an increase in the number of people who lack health insurance.
Immigration
The number of apprehensions of people trying to enter the U.S. illegally at the southwest border remains historically high, but since our last report in January, the situation has changed markedly. In part due to seasonal trends and policies implemented by the Biden administration, the number of apprehensions significantly declined in January and February — to numbers not seen since shortly after Biden took office.
On March 24, Biden boasted that “the number of migrants arriving on our southern border has dropped precipitously.”
The number of apprehensions rose in March, but still remained well below the number from March 2022. However, an immigration expert cautioned the U.S. may be seeing the “calm before the storm” should the Biden administration end Title 42, a public health law the Trump administration invoked early in the pandemic that allows border officials to immediately return many of those caught trying to enter the country illegally.
Looking at the entirety of Biden’s time in office, and to even out the seasonal changes in border crossings, we compare the most recent 12 months on record with the year prior to him taking office. And for the past 12 months ending in March, the latest figures available, apprehensions totaled 2,246,798, according to U.S. Customs and Border Protection. That’s 342% higher than during Trump’s last year in office.
Apprehensions by the U.S. Border Patrol hit 221,710 in December, the second highest monthly total on record. But in January, that number dropped nearly 42% to 128,936. And it remained about the same in February, at 130,024. (Those figures were 13% and 18% lower than the same months in 2022.) The number rose in March to 162,317, though that’s 23% below the level in March 2022.
According to Ariel G. Ruiz Soto, an associate policy analyst at the Migration Policy Institute, part of the drop was likely due to seasonal factors. January tends to be a slow month for illegal immigration, because of the holiday season across Latin America.
But Biden administration policies also played a role, he said. In early January, Biden unveiled several border enforcement initiatives that included expanding the “parole” process for Venezuelans to Nicaraguans, Haitians and Cubans, allowing applicants a two-year work permit if they have a sponsor in the U.S. and they pass a background check.
At the same time, the administration expanded Title 42 to include Nicaragua, Cuba and Haiti, meaning people from those countries caught illegally crossing into the U.S. could be immediately expelled.
Those changes contributed to the declining number of apprehensions at the border to a more manageable level in January and February, Ruiz Soto said. But that may change dramatically if the Biden administration follows through with its plan to end Title 42 on May 11, when the policy is set to expire, he said.
“That could incentivize increased migration in April,” Ruiz Soto said, and could lead to a “significant surge” in May. If so, he said, the decline in apprehensions in January and February could prove to have been just a temporary lull.
In anticipation of the end of Title 42, the Biden administration has been increasing expedited removals under Title 8, which stipulates that someone caught trying to cross illegally is barred from legal entry for five years. Those caught attempting to cross illegally multiple times can be charged criminally.
In addition, the administration is also pursuing a rule that would mean those attempting to cross into the U.S. illegally would have a “presumption of asylum ineligibility” in the U.S. if they have failed to seek asylum in another country on their travels to the U.S.
Even with the lower numbers in January and February, the number of apprehensions remains historically very high under Biden. Part of that is due to the same people making multiple attempts to cross the border, what is known as the recidivism rate. Title 42 carries no consequences for Mexicans immediately turned around at the border, Ruiz Soto said, and so many of them try again repeatedly.
In addition, he said, there are some “push factors” encouraging migration by Mexicans. One factor is an increase in drug and cartel activity in Mexico, Ruiz Soto said. In addition, he said, “Mexico has really struggled to recover from the pandemic.”
Food Stamps
The number of people in the Supplemental Nutrition Assistance Program, or SNAP, formerly known as food stamps, increased again since our last update.
As of January, nearly 42.7 million people were receiving food assistance, the highest monthly enrollment since Biden has been in office. That figure is up 344,515 people from October, and it’s an increase of about 1.2%, or 504,274 people, from January 2021, when Biden became president. The figures come from Department of Agriculture data published this month.
Under Biden, SNAP enrollment was as low as 40.8 million in August and September 2021. Trump’s lowest month was February 2020, when the program had 36.9 million participants.
Trade Deficit
The international trade deficit has gone up under Biden.
Figures published this month by the Bureau of Economic Analysis show the U.S. imported about $909.8 billion more in goods and services than it exported over the last 12 months through February. That’s an increase of nearly $256 billion, or roughly 39%, compared with 2020.
Through the first two months of 2023, however, the trade gap in goods and services decreased $35.5 billion, or 20.3%, from the same period in 2022, the BEA said. The $945.3 billion trade deficit in 2022 was the largest on record going back to 1960.
Crude Oil Production and Imports
U.S. crude oil production averaged roughly 11.97 million barrels per day during Biden’s most recent 12 months in office (through January), according to Energy Information Administration data released in March. That was 5.7% higher than the average daily amount of crude oil produced in 2020.
Crude oil production averaged 11.88 million barrels per day throughout 2022, the EIA said. That’s the highest annual average since 2019. According to its Short-Term Energy Outlook published in April, the EIA expects crude oil production to increase to a record 12.54 million barrels per day in 2023.
Meanwhile, imports of crude oil averaged 6.27 million barrels per day in Biden’s last 12 months. That’s up nearly 6.7% from average daily imports in 2020.
The EIA projects crude oil imports will exceed exports by 2.85 million barrels per day in 2023 — which is a 6.7% increase in net imports from 2020 to 2022.
Carbon Emissions
Last year, there were about 4.96 billion metric tons of emissions from the consumption of coal, natural gas and various petroleum products, according to the EIA. That total is 1.2% more than in 2021 and 8.4% above 2020.
The EIA currently forecasts that the U.S. will have 4.79 billion metric tons of energy-related emissions in 2023. That would be a decline of 3.4% from 2022 and almost 7% below the 5.15 billion metric tons emitted pre-pandemic in 2019.
Debt and Deficits
Debt — Since our last quarterly update, the public debt, which excludes money the government owes itself, has changed only slightly. It increased $9.1 billion to over $24.6 trillion, as of April 24, bringing the total increase under Biden to $2.97 trillion. That’s 13.7% higher than it was when Biden took office — unchanged from our last report.
Deficits — So far, the Congressional Budget Office estimates that the budget deficit for fiscal year 2023 is ahead of where it was at this point in fiscal 2022, when the Treasury Department said the deficit for the full fiscal cycle approached $1.38 trillion.
Through the first six months of the current fiscal year (October to March), the deficit was $1.1 trillion, or “$430 billion more than the shortfall recorded during the same period last year,” the CBO said in its most recent Monthly Budget Review.
In February, the CBO projected that the FY 2023 deficit would increase slightly to $1.41 trillion. That’s $426 billion more than it projected in May 2022, CBO said.
Gun Sales
Gun purchases appeared to decline again during the first quarter of 2023, according to numbers from the National Shooting Sports Foundation, a gun industry trade group.
The NSSF estimates gun sales by tracking the number of background checks for firearm sales based on the FBI’s National Instant Background Check System, or NICS. The NSSF-adjusted figures exclude background checks unrelated to sales, such as those required for concealed-carry permits. We rely on these figures because the federal government doesn’t collect data on gun sales.
The NSSF-adjusted NICS total for background checks during the first three months of 2023 was about 4.17 million, the group reported. That’s down more than 1% from 4.21 million in the first quarter of 2022 and almost 24% lower than the first quarter of 2021.
The first quarter figure for 2023 is about 26% lower than the almost 5.63 million during Trump’s last quarter in 2020, which was a record year for background checks for firearm sales.
Crime
The number of murders in 70 large U.S. cities went up by 1.6% from 2020 to 2022, according to the latest reports from the Major Cities Chiefs Association.
The small increase reflects a decline in murders last year (down 5.1%) after two straight years of increases — a 33.4% jump from 2019 to 2020, before Biden took office (based on statistics from 67 large cities) and a much smaller 6.2% increase from 2020 to 2021, Biden’s first year in office (based on 70 large cities).
Despite last year’s decrease, the number of murders — 9,138 in 2022 — is not back down to the pre-pandemic 2019 level, which totaled 6,406, though the latter figure is based on three fewer law enforcement agencies.
AH Datalytics, an independent criminal justice data analysis group, has found murders are continuing to go down in 2023. Its work, based on publicly available information from 73 large law enforcement agencies nationwide, shows a 10.2% decline in murders as of April 26, compared with the same period last year — with more than half of the agencies’ figures updated as of this month.
From 2020 to 2022, the Major Cities Chiefs Association also found a 7.5% increase in the number of rapes, a 1.8% rise in robberies and a 14.1% increase in aggravated assaults.
We won’t have nationwide crime figures from the FBI for 2022 until this fall. As we’ve reported in our last two Biden’s Numbers updates, the FBI estimated that “violent and property crime remained consistent between 2020 and 2021.”
There have been several mass murders in the country in the last few years, including the May 2022 killings of 19 students and two teachers at an elementary school in Uvalde, Texas, and 10 people in a racially motivated attack at a supermarket in Buffalo, New York, and more recently, the killing of three children and three adults at a school in Nashville in March. In response to these mass shootings, Biden has repeatedly called for a ban on semi-automatic weapons and large capacity magazines.
The Gun Violence Archive determined there were 36 mass murders in 2022, compared with 28 in 2021, 21 in 2020 and 31 in 2019. The group defines “mass murder” as a single incident in which at least four people were killed, not including the shooter.
Another gun violence database created by Mother Jones provides a count of “mass shootings,” defined as three or more victims in a shooting in a public place. Unlike in the Gun Violence Archives database, incidents in private homes or stemming from gang activity or robberies are not included. Mother Jones found 12 mass shootings in 2022, six in 2021, two in 2020 and 10 in 2019.
The FBI maintains statistics on what it calls “active shooter” incidents, in which “one or more individuals” is “actively engaged in killing or attempting to kill people in a populated area.” There were 50 active shooter incidents in 2022, 61 in 2021, 40 in 2020 and 28 in 2019.
Judiciary Appointments
Supreme Court — Biden’s Supreme Court nominees still stand at one: Justice Ketanji Brown Jackson, who was confirmed on April 7, 2022, and replaced retired Justice Stephen G. Breyer, an appointee of President Bill Clinton. Trump had won confirmation for two — Justices Neil Gorsuch and Brett Kavanaugh — at the same point during his term.
Court of Appeals — Under Biden, 31 U.S. Court of Appeals judges have been confirmed. At the same point under Trump, 37 had been confirmed.
District Court — Biden has racked up 87 District Court confirmations, while Trump had 58 nominees confirmed at the same time during his presidency.
Two U.S. Court of Federal Claims judges also have been confirmed under Biden.
As of April 19, there were 78 federal court vacancies, with 36 nominees pending.
Home Prices & Homeownership
Home prices — The Fed’s attempts to slow inflation by repeatedly raising interest rates put the brakes on home prices last year. But the median price of existing, single-family homes has started to climb again.
The median price of an existing, single-family home sold in March was $380,000, according to the National Association of Realtors. That’s down from a year ago ($385,400), but it’s also the second consecutive month that home prices had gone up after a seven-month slide, NAR data show.
“While prices have dropped from where they were at their peak this time last year, they are still above 2021 prices in many markets,” Lindsay McLean, the CEO of HomeLister told gobankingrates.com. “Mortgage rates have stabilized a bit and offer activity seems to be resuming, as buyers are slowly coming back to the table.”
The Fed began raising interest rates on March 16, 2022, increasing rates last month for the ninth time in 12 months.
The median price of an existing, single-family home reached a high of $420,900 in June, according to the NAR. But, as mortgage rates continued to climb, prices tumbled for seven consecutive months, dropping to $365,400 in January.
Despite the swing in prices, the March median price was 23.4% higher than it had been in January 2021, when Biden took office. Annual home prices have been rising since 2012, in large part because of a high demand and relatively low inventory, according to the nonpartisan Congressional Research Service.
Homeownership — Homeownership rates have remained virtually unchanged under Biden.
The homeownership rate, which the Census Bureau measures as the percentage of “occupied housing units that are owner-occupied,” was 65.9% in the fourth quarter of 2022 — similar to the 65.8% rate during Trump’s last quarter in office. (Usual word of caution: The bureau warns against making comparisons with the fourth quarter of 2020, because of pandemic-related restrictions on in-person data collection.)
The rate peaked under Trump in the second quarter of 2020 at 67.9%. The highest homeownership rate on record was 69.2% in 2004, when George W. Bush was president.
Refugees
Biden remains far from fulfilling his ambitious campaign goal of accepting up to 125,000 refugees a year.
As president, Biden set the cap on refugee admissions for fiscal year 2023 at 125,000 – just as he did in fiscal year 2022. To achieve that goal, the administration would have to admit an average of 10,417 refugees per month.
However, in fiscal year 2022, the administration accepted only 25,465 refugees, or 2,122 per month, according to State Department data. In the first six months of fiscal year 2023, which began Oct. 1, the administration increased its monthly average, welcoming 18,429 refugees, or 3,072 per month. (See “Refugee Admissions Report” for monthly data from 2000 through 2023.)
Overall, the U.S. has admitted 53,904 refugees in Biden’s first full 26 months in office, or 2,073 refugees per month, the data show. That’s about 12% higher than the 1,845 monthly average during the four years under Trump, who significantly reduced the admission of refugees. (Technical point: For both presidents, our monthly averages include only full months in office, excluding the month of January 2017 and January 2021, when administrations overlapped.)
In its report to Congress for fiscal year 2023, the State Department said “we are beginning to make progress towards fulfilling President Biden’s ambitious admissions target.” It is true that the average monthly refugee admissions have increased under Biden. The 3,072 monthly average in the first six months of fiscal year 2023 is the highest it has been for the same six-month period since fiscal year 2017, which includes months under both Trump and his predecessor, President Barack Obama.
But if it maintains its current pace, the administration would accept 36,864 refugees in fiscal year 2023 — which is much higher than last fiscal year, but far short of Biden’s campaign goal of 125,000.
Editor’s note: FactCheck.org does not accept advertising. We rely on grants and individual donations from people like you. Please consider a donation. Credit card donations may be made through our “Donate” page. If you prefer to give by check, send to: FactCheck.org, Annenberg Public Policy Center, P.O. Box 58100, Philadelphia, PA 19102.
Sources
U.S. Bureau of Labor Statistics. “Employment, Hours, and Earnings from the Current Employment Statistics survey (National): Total Nonfarm.” Accessed 25 Apr 2023.
U.S. Bureau of Labor Statistics. “Labor Force Statistics from the Current Population Survey: Unemployment.” Accessed 25 Apr 2023.
U.S. Bureau of Labor Statistics. “Job Openings and Labor Turnover Survey: Job Openings.” Accessed 25 Apr 2023.
U.S. Bureau of Labor Statistics. “Labor Force Statistics from the Current Population Survey: Labor Force Participation Rate.” Accessed 25 Apr 2023.
U.S. Bureau of Labor Statistics. Monthly Labor Review. “Projections overview and highlights, 2021–31” Nov 2022.
U.S. Bureau of Labor Statistics. “Employment, Hours, and Earnings from the Current Employment Statistics survey (National): Manufacturing.” Accessed 25 Apr 2023.
U.S. Bureau of Labor Statistics. “Consumer Price Index – All Urban Consumers (Seasonally Adjusted).” Data extracted 25 Apr 2023.
U.S. Bureau of Labor Statistics. Consumer Price Index Summary. News release. 13 Jul 2022.
U.S. Bureau of Labor Statistics, “Gasoline (all types) in U.S. city average, all urban consumers, seasonally adjusted.” Data extracted 25 Apr 2023.
U.S. Energy Information Administration. “Weekly U.S. Regular All Formulations Retail Gasoline Prices.” Data extracted 25 Apr 2023.
Bureau of Labor Statistics. “Employment, Hours and Earnings from the Current Employment Statistics survey (National); Average Weekly Earnings of Production and Nonsupervisory Employees, total private.” Data extracted 25 Apr 2023.
Bureau of Labor Statistics. “Employment, Hours and Earnings from the Current Employment Statistics survey (National); Average Weekly Earnings of Production and Nonsupervisory Employees, 1982-1984 dollars, total private.” Data extracted 25 Apr 2023.
University of Michigan Surveys of Consumers. Preliminary Results for April 2023. Accessed 17 Apr 2023.
Rugaber, Christopher. “U.S. inflation eases but stays high, putting the Federal Reserve in a tough spot.” Associated Press. 14 Mar 2023.
University of Michigan Surveys of Consumers. “The Index of Consumer Sentiment. Table 1a.” Undated, accessed 17 Apr 2023.
National Association of Realtors. “Sales Price of Existing Single-Family Homes.” Undated, accessed 24 Apr 2023.
National Association of Realtors. “Sales Price of Existing Single-Family Homes.” Undated, accessed 16 Jan 2023.
“2023 Housing Market Correction: Forecast for the Rest of the Year.” gobankingrates.com. Undated, accessed 24 Apr 2023.
Horsley, Scott. “The Federal Reserve raises interest rates for the first time since 2018.” NPR. 16 Mar 2022.
Rugaber, Christopher. “Fed raises key rate by quarter-point despite bank turmoil.” Associated Press. 22 Mar 2023.
National Association of Realtors. “Sales Price of Existing Single-Family Homes.” Undated, accessed 16 Jan 2023.
“Introduction to U.S. Economy: Housing Market.” Congressional Research Service. 3 Jan 2023.
“High Home Prices: Contributing Factors and Policy Considerations.” Congressional Research Service. 18 Feb 2022.
U.S. Census Bureau. “Time Series/Trend Charts: Not Seasonally Adjusted Home Ownership Rate.” Undated, accessed 18 Apr 2023.
U.S. Census Bureau. “Homeownership in the United States: 2005 to 2019.” March 2021.
U.S. Census Bureau. “Quarterly Residential Vacancies and Homeownership, Fourth Quarter 2021.” 2 Feb 2022.
U.S. Bureau of Economic Analysis, “Corporate Profits After Tax (without IVA and CCAdj) [CP].” Updated 30 Mar 2022; accessed 13 Apr 2022.
U.S. Bureau of Economic Analysis. “Table 1.1.1. Percent Change From Preceding Period in Real Gross Domestic Product.” Accessed 26 Apr 2022.
U.S. Bureau of Economic Analysis. “Gross Domestic Product, Fourth Quarter and Year 2022 (Third Estimate), GDP by Industry, and Corporate Profits.” 30 Mar 2023.
Cox, Jeff. “U.S. GDP accelerated at 2.6% pace in Q3, better than expected as growth turns positive.” CNBC. 27 Oct 2022.
Cox, Jeff. “U.S. GDP rose 2.9% in the fourth quarter, more than expected even as recession fears loom.” CNBC. 26 Jan 2023.
Lundh, Erik and Ataman Ozyildirim. “Probability of US Recession Remains Elevated.” The Conference Board. 12 Apr 2023.
Federal Reserve Bank. “Federal Reserve issues FOMC statement.” 22 Mar 2023.
“The Biden Plan for Securing Our Values as a Nation of Immigrants.” Biden campaign. Undated, accessed 8 Apr 2022.
State Department. “The Presidential Determination on Refugee Admissions for Fiscal Year 2022.” Press release. 8 Oct 2021.
White House. “Memorandum on Presidential Determination on Refugee Admissions for Fiscal Year 2023.” 27 Sep 2022.
State Department. “Refugee Admissions Report as of March 31, 2023.” Accessed 24 Apr 2023.
State Department. “Report to Congress on Proposed Refugee Admissions for Fiscal Year 2023.” 8 Sep 2022.
“NSSF-Adjusted NICS Background Checks for January 2023.” Dealer Wire. 3 Feb 2023
“NSSF-Adjusted NICS Background Checks for February 2023.” Dealer Wire. 3 Mar 2023.
“NSSF-Adjusted NICS Background Checks for January 2023.” Dealer Wire. 14 Apr 2023.
U.S. Department of Agriculture. Supplemental Nutrition Assistance Program. Persons, Households, Benefits, and Average Monthly Benefit per Person & Household. Accessed 19 Apr 2023.
U.S. Bureau of Economic Analysis. U.S. Trade in Goods and Services, 1960-present. Accessed 19 Apr 2023.
U.S. Bureau of Economic Analysis. “U.S. International Trade in Goods and Services, February 2023.” 5 Apr 2023.
U.S. Energy Information Administration. U.S. Field Production of Crude Oil. Accessed 24 Apr 2023.
U.S. Energy Information Administration. U.S. Imports of Crude Oil. Accessed 24 Apr 2023.
U.S. Energy Information Administration. U.S. Net Imports of Crude Oil. Accessed 24 Apr 2023.
U.S. Energy Information Administration. “Monthly Energy Review, March 2023.” Table 11.1 Carbon Dioxide Emissions From Energy Consumption by Source. 28 Mar 2023.
U.S. Energy Information Administration. “Short-Term Energy Outlook, April 2023.” 11 Apr 2023.
U.S. Energy Information Administration. “Short-Term Energy Outlook, April 2023.” Table 4a. U.S. Petroleum and Other Liquids Supply, Consumption, and Inventories. 11 Apr 2023.
Congressional Budget Office. “Monthly Budget Review: March 2023.” 10 Apr 2023.
Congressional Budget Office. “The Budget and Economic Outlook: 2023 to 2033.” 15 Feb 2023.
U.S. Department of Treasury. Debt to the Penny. Accessed 25 Apr 2023.
Centers for Disease Control and Prevention; National Health Interview Survey. “Health Insurance Coverage: Early Release of Quarterly Estimates From the National Health Interview Survey, July 2021–September 2022.” Jan 2023.
Centers for Disease Control and Prevention; National Health Interview Survey. “Health Insurance Coverage: Early Release of Quarterly Estimates From the National Health Interview Survey, July 2020–September 2021.” Jan 2022.
Tolbert, Jennifer and Meghana Ammula. “10 Things to Know About the Unwinding of the Medicaid Continuous Enrollment Provision.” Kaiser Family Foundation. 5 Apr 2023.
Williams, Elizabeth et al. “Fiscal and Enrollment Implications of Medicaid Continuous Coverage Requirement During and After the PHE Ends.” Kaiser Family Foundation. 10 May 2022.
Department of Health and Human Services, Assistant Secretary for Planning and Evaluation. “Unwinding the Medicaid Continuous Enrollment Provision: Projected Enrollment Effects and Policy Approaches.” 19 Aug 2022.
Major Cities Chiefs Association. Violent Crime Survey – National Totals. Year End Comparison January 1 to December 31, 2022, and 2021. 10 Feb 2022.
Major Cities Chiefs Association. Violent Crime Survey – National Totals. Year End Comparison January 1 to December 31, 2021, and 2020. 10 Feb 2022.
Major Cities Chiefs Association. Violent Crime Survey – National Totals. Year End Comparison January 1 to December 31, 2020, and 2019. updated 14 Feb 2022.
YTD Murder Comparison. AH Datalytics. accessed 26 Apr 2023.
FBI. “FBI Releases 2021 Crime in the Nation Statistics.” Press release. 5 Oct 2022.
Gun Violence Archive. Past Summary Ledgers. accessed 26 Apr 2023.
Follman, Mark et al. “US Mass Shootings, 1982–2023: Data From Mother Jones’ Investigation.” Mother Jones. last updated 10 Apr 2023.
FBI. Active Shooter Incidents. accessed 26 Apr 2023.
United States Courts. Confirmation Listing, Judicial Confirmations, 118th Congress. updated 26 Apr 2023.
United States Courts. Current Judicial Vacancies, 118th Congress. updated 26 Apr 2023.
United States Courts. Confirmation Listing, Judicial Confirmations for January 2023, 117th Congress. updated 1 Jan 2023.
United States Courts. Confirmation Listing, Judicial Confirmations for January 2019. updated 1 Jan 2019.
U.S. Customs and Border Protection. Southwest Land Border Encounters. Accessed 25 Apr 2023.
U.S. Customs and Border Protection. Total Illegal Alien Apprehensions by Month, FY 2000-2020. Accessed 25 Apr 2023.
U.S. Customs and Border Protection. Nationwide Encounters Fiscal Years 1925 – 2020. Accessed 25 Apr 2023.
White House website. Remarks by President Biden and Prime Minister Trudeau of Canada in Joint Press Conference. 24 Mar 2023.
White House website. FACT SHEET: Biden-Harris Administration Announces New Border Enforcement Actions. 5 Jan 2023.
U.S. Customs and Border Protection. Nationwide Enforcement Encounters: Title 8 Enforcement Actions and Title 42 Expulsions 2022. Accessed 25 Apr 2023.
Montoya-Galvez, Camilo. “Biden expands Title 42 expulsions while opening legal path for some migrants.” CBS News. 5 Jan 2023.
U.S. Department of Homeland Security. “DHS Continues to Prepare for End of Title 42; Announces New Border Enforcement Measures and Additional Safe and Orderly Processes.” 5 Jan 2023.
Garcia, Uriel J. and Ura, Alexa. “U.S. Supreme Court rules to keep Title 42, the pandemic-era policy to quickly turn away migrants, for now.” Texas Tribune. 27 Dec 2022.
U.S. Customs and Border Protection. CBP Enforcement Statistics Fiscal Year 2023: U.S. Border Patrol Recidivism Rates. Accessed 25 Apr 2023.