Summary
The final numbers for Joe Biden’s full term are nearly all in. Here’s our rundown of various statistical measures during his presidency:
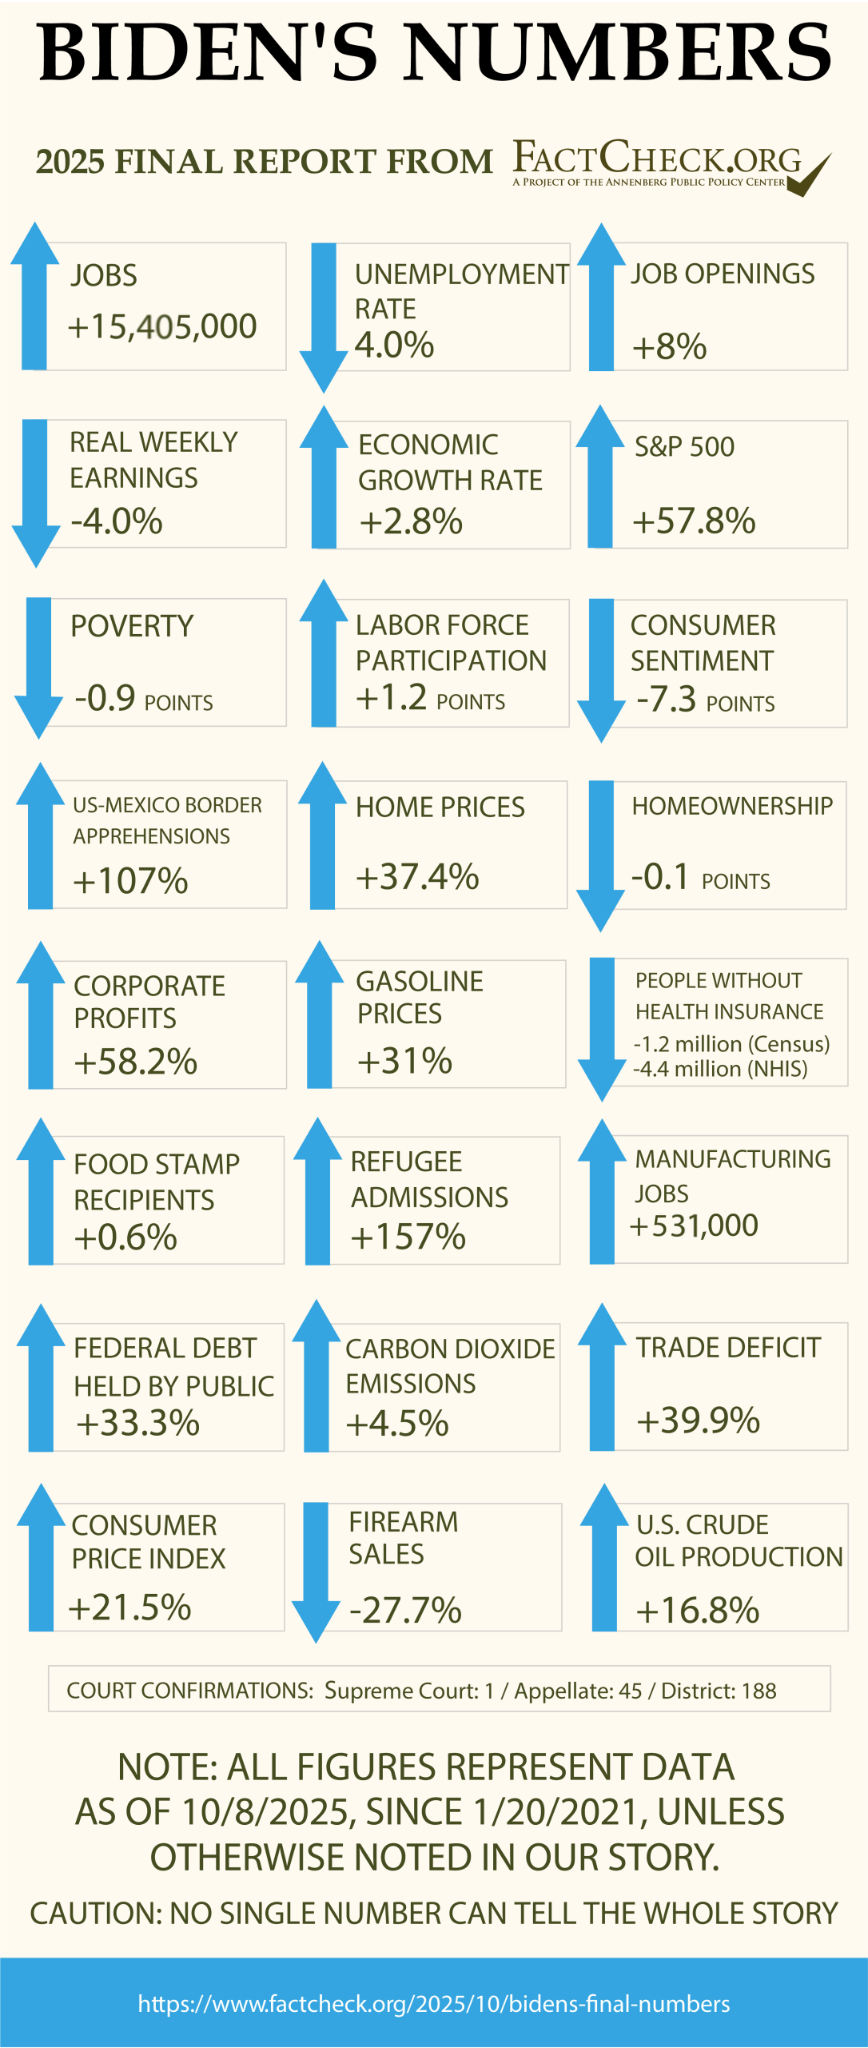
- Inflation roared back, shrinking the value of workers’ paychecks. Consumer prices rose 21.5%. Gasoline alone rose 31%. After adjusting for inflation, private-sector average weekly earnings shrank 4%.
- The economy regained millions of jobs lost during the coronavirus pandemic and around 6 million more. Unemployment averaged 4.1%, well below the historical average.
- The economy grew by at least 2.5% each year, with real gross domestic product growth of 2.8% in 2024.
- The percentage and number of Americans who lacked health insurance went down by 0.6 percentage points, or 1.2 million people, when measuring those who were uninsured for an entire year.
- The nationwide violent crime and property crime rates declined. The murder rate dropped by 1.7 points.
- All three major U.S. stock indexes set new records. The S&P 500 climbed 57.8%.
- After-tax corporate profits continued to set records.
- Consumer confidence sank to a historic low, when inflation surged, and then rose. But it was still lower when Biden left office than when his term began.
- Apprehensions of those trying to cross the southern border illegally were 107% higher in Biden’s last year compared with the year before he took office.
- The monthly average for refugee admissions was 157% higher than during his predecessor’s time in office.
- The U.S. trade deficit in goods and services went up by nearly 40%.
- Home prices rose 37.4%. The homeownership rate fluctuated slightly.
- The number of people receiving federal food assistance increased only slightly.
- The median household income, when factoring in inflation, went up by $2,150. The official poverty rate declined, but the alternative, supplemental measure increased, after pandemic stimulus payments ended.
- The federal publicly held debt went up by one-third.
- Crude oil, natural gas, natural gas plant liquids, biofuels, solar and wind all set domestic production records in Biden’s last year in office.
Analysis
We’ve been publishing quarterly “numbers” articles about how the country has fared under the president since Barack Obama’s second term. We last posted an update for President Joe Biden in October 2024, weeks before Election Day, and a look at what President Donald Trump inherited on Jan. 20. But it takes some time for many of the final figures to be gathered, revised and released. We’re nearly at that point now.
The headline measure during Biden’s term — and a defining issue during the 2024 election — was the increase in inflation, particularly in 2022. Economists told us then that COVID-19 stimulus spending under Biden contributed to the rise in prices, though the root cause was the economic fallout from the pandemic, which created issues with supply, demand and labor, not just in the U.S. but around the world. Sanctions on Russian oil, after Russia’s invasion of Ukraine in February 2022, further contributed.
Other economic measures showed a country recovering from the pandemic, with employment hitting its pre-pandemic level and growing by millions more, and economic growth rebounding from 2020’s dip.
Some statistics are a continuation of what occurred under Trump’s first term: The stock market and after-tax corporate profits again set records, for example. Other figures moved in the opposite direction than they did under Biden’s predecessor: Refugee admissions more than doubled, and the number of people lacking health insurance declined.
The statistics below may be good, bad or neutral in the eye of the beholder, and we leave those judgments to the reader. Opinions also differ on how much credit or blame a president should get for what happens while he is in office.
We expect some of these figures to be revised by the government, and we’ll update them again, as we did for Obama and Trump. We’ll launch our second “Trump’s Numbers” series in January, one year after Trump’s second term began.
Wages and Inflation
During Biden’s four years in office, wages went up but prices went up faster.
CPI — The Consumer Price Index rose 21.5% under Biden — ending a long period of low inflation. Prices rose only 7.8% during the previous four years, for comparison.
The worst spike came during the 12 months ending in June 2022, which saw a 9.1% increase in the CPI (before seasonal adjustment). The Bureau of Labor Statistics said that was the biggest such increase in over 40 years — since the 12 months ending in November 1981.
Inflation cooled slowly for the remainder of Biden’s term, as the Federal Reserve ratcheted up interest rates. The CPI rose 3% in his final 12 months.
Gasoline Prices — Inflation was advertised in foot-high letters on street corners everywhere as the price of gasoline shot up to a record high during Biden’s time.
The week before he took office the national average price of regular gasoline at the pump was $2.38 per gallon, still rising from the $1.78 low point during the pandemic recession (which lasted from February to April 2020), according to figures from the Energy Information Administration. From there it shot up to the highest ever recorded — just over $5 per gallon in the week ending June 13, 2022 — as world oil markets were disrupted by Russia’s invasion of Ukraine.
The week he left office the price was down to $3.11, still 73 cents (or 31%) higher than when he came in.
Wages — Paychecks grew larger also, but inflation ate up all the gain and more, leaving workers’ purchasing power worse off than before.
The average weekly earnings of all private-sector workers rose 16.7%, not nearly enough to compensate for rising prices. In “real” (inflation-adjusted) terms, weekly earnings fell 4%, according to the Bureau of Labor Statistics. That reversed nearly half the gains of the previous four years, when real weekly earnings increased 8.6%
Those figures apply to all private-sector workers, including executives and professionals. But the story was similar for rank-and-file production and nonsupervisory workers — who make up 81% of the entire private-sector workforce. For them, the drop in real weekly earnings under Biden was 2%, following a 9.5% increase over the previous four years.
Jobs and Unemployment
Employment — During Biden’s four years the economy completed recovering jobs lost in the 2020 recession caused by the coronavirus pandemic and added millions more.
Overall, total nonfarm employment grew by 15.4 million under Biden, according to the final, revised figures from the BLS. And according to those figures, there were 5,975,000 more jobs when he left office than there were at the high point prior to the pandemic.
Update, March 5, 2026: We updated these employment figures after BLS released revised numbers in February as part of its annual “benchmarking” process.
Unemployment — When Biden took office the unemployment rate was 6.4% and falling, as the economy struggled to recover from the pandemic (when the rate peaked at 14.8%). The rate fell to a low of 3.4% for the month of April 2023, and was 4% the month he left office. (That number won’t change. It is based on household survey data not affected by benchmarking of total payroll data.)
The average jobless rate for all 48 months of Biden’s presidency was 4.1%. That’s well below the average of 5.7% for all the months since January 1948, when the BLS began its current tracking.
Job Openings — The number of unfilled job openings soared during Biden’s first year in office, reaching a record of over 12 million in March 2022. That was the highest since the BLS began tracking openings in December 2000.
But hiring cooled after the Federal Reserve began a steep series of interest rate increases aimed at cooling the economy to bring down price inflation. The number of unfilled openings was still nearly 7.8 million in January 2025 when he left office, about 8% higher than when he came in.
As Biden left office there were still 1.1 jobs open for every person seeking work. When Biden took office it was the opposite: more job seekers than job openings.
Labor Force Participation — The labor force participation rate rose a bit during Biden’s time as workers returned following pandemic layoffs.
The rate rose from 61.4% in January 2021 to 62.6% when he departed. However, that was still lower than the pre-pandemic level of 63.3% in February 2020.
The rate — which is the percentage of the total population over age 16 that is either employed or actively seeking work — has been trending generally downward since the turn of the century. It peaked at 67.3% during the first four months of 2000. Labor Department economists project that the rate will continue to slide, to 61.2% in 2033, primarily due to the aging of the U.S. population.
Manufacturing Jobs — During the presidential campaign, Biden promised he had a plan to create a million new manufacturing jobs — but he fell short.
The U.S. added 531,000 manufacturing jobs during Biden’s time, a 4.4% increase. But the total number of jobs was actually 117,000 (or 0.9%) lower when he left than the highest level during his predecessor’s time in office — which was in January and July 2019.
Economic Growth
Real, meaning inflation-adjusted, gross domestic product went up by 2.8% in 2024, according to the Bureau of Economic Analysis. That was down by one-tenth of a percentage point from the 2.9% increase in 2023, but it still was the fourth year of at least 2.5% economic growth under Biden.
The increase in real GDP under Biden peaked at 6.2% in 2021, as the economy rebounded after shrinking by 2.1% in 2020 because of the economic collapse caused by the pandemic. During Trump’s first term, growth peaked at 3% in 2018.
Health Insurance
Under Biden, the percentage and number of Americans who are uninsured declined.
The drop was 1.5 percentage points, or 4.4 million people, from 2020, the year before Biden took office, to 2024, according to the National Health Interview Survey, which measures the uninsured at the time people were interviewed.
Annual reports from the Census Bureau, which measures those who were uninsured for the entire calendar year, also showed a decline, but of a smaller magnitude: The uninsured rate went down by 0.6 percentage points, or 1.2 million people, from 2020 to 2024.
The NHIS, a project of the National Center for Health Statistics at the Centers for Disease Control and Prevention, found that 8.2% of the population, or 27.2 million people, were uninsured in 2024, according to its early release estimates published in June. The latest Census Bureau report, released in September, similarly put the uninsured rate at 8%.
We had been noting in these “Biden’s Numbers” articles that there could be some increase in the uninsured last year, as some Medicaid provisions that were enacted during the COVID-19 pandemic started to be phased out at the end of March 2023. That happened a bit: The 2024 uninsured rate, according to NHIS, was 0.6 percentage points higher than in 2023, an increase NHIS called “not significantly different.”
The Census Bureau reports show the percentage of the uninsured has been basically flat — at 8% — over the past three years. Those with Medicaid coverage declined by about 3.3 million from 2023 to 2024.
Enrollment in the Affordable Care Act marketplaces, where those without employer or public insurance can buy their own policies, more than doubled under Biden, growing from 11.4 million in 2020 to 24.3 million in 2025, according to data from the Centers for Medicare & Medicaid Services. As we’ve explained before, Biden signed into law more generous ACA tax credits, or subsidies, in 2021. Those boosted subsidies are set to expire at the end of this year. A congressional battle over extending them led to a government shutdown on Oct. 1.
Crime
FBI crime statistics show a decrease in violent and property crime during Biden’s term.
The FBI’s annual “Crime in the United States” report for 2024 was released on Aug. 5. The data show that in Biden’s last year in office, the violent crime rate was 359.1 per 100,000 population, a decline of 33.2 points from 2020. The property crime rate was 1,760.1 per 100,000 population, a drop of 186.3 points from 2020. (For these figures, see Table 1 after downloading the CIUS Estimations file under Crime in the United States Annual Reports.)
The murder rate dropped from 6.7 in 2020 to 5 in 2024, and the number of murders declined by 23%. The number of aggravated assaults went down by 3.5%.
The only category showing an increase was motor vehicle thefts. The rate went up by 13.4 points and the number by 8.9%.
The FBI data come from voluntary reports from law enforcement agencies nationwide. Agencies representing 95.6% of the U.S. population submitted statistics for 2024, the FBI said.
Reports from other organizations mirror the FBI’s findings. The Major Cities Chiefs Association reports show a 23.3% decline in the number of murders in 70 large U.S. cities from 2020 to 2024. (Note: We added in New York City’s figures for 2024, which were missing from the latest Major Cities Chiefs report.)
A January analysis from the Council on Criminal Justice on reported crime in 40 U.S. cities through December 2024 found that “most violent crimes are at or below levels seen in 2019, the year prior to the onset of the COVID pandemic and racial justice protests of 2020,” when violent crime increased. The CCJ report found that rates for homicide, sexual assault, domestic violence and robbery in 2024 were lower than in 2019. Rates for aggravated assault, gun assault and carjacking had declined from the 2020 rate but were still higher than 2019.
Stock Market
The stock market gains under Trump continued under Biden, setting new records.
On Jan. 17, 2025, the S&P 500, which is made up of 500 large-cap companies, closed at 57.8% above where it had been the day before Biden was inaugurated in 2021.
The Dow Jones Industrial Average, made up of 30 large corporations, was up 40.6% during Biden’s time in office.
And the Nasdaq composite index, made up of more than 3,000 companies including many in the technology sector, increased by almost half – 48.7% – in Biden’s four years.
These gains followed significant increases in the market during the first Trump administration, when the S&P rose 67.8%, the Dow Jones went up 56.7%, and the Nasdaq more than doubled.
Corporate Profits
After-tax profits for corporations continued to climb year after year under Biden, setting new records each time. (The figures are nominal, meaning they aren’t adjusted for inflation.)
Bureau of Economic Analysis records show (line 45) corporate profits increased to about $2.9 trillion in 2021, to $3 trillion in 2022, to $3.2 trillion in 2023 and to roughly $3.5 trillion in 2024.
Profits last year were up about 58.2% from 2020, when, despite the impact of the pandemic, corporations made a then record of about $2.2 trillion in profits after taxes.
Consumer Sentiment
Consumer confidence experienced volatility during the Biden years, sinking to a record low as the nation recovered from the pandemic and struggled with high prices. Consumer sentiment rose by the end of Biden’s term, but was still lower than when he took office.
The University of Michigan’s Surveys of Consumers showed that its Index of Consumer Sentiment for January, when Biden left office, was 71.7 — 7.3 points lower than the index of 79 in January 2021 when his term began.
During Biden’s tenure, consumer sentiment peaked at 88.3 in April 2021 and hit the historic low of 50 in June 2022.
“The top concern on consumers’ minds coming out of the pandemic was inflation and high prices. Sentiment hit an all-time low in June 2022 as inflation hit its peak,” Joanne W. Hsu, director of the Surveys of Consumers, told us in an email.
“For about 2 years thereafter, consumer sentiment gradually improved (primarily for higher income consumers) as inflation slowed, but consumers remained frustrated by high prices/cost of living,” Hsu said.
Illegal Immigration
Illegal border crossings, as measured by apprehensions at the southwest border, were 107% higher in Biden’s final year in office compared with the last full year before he was sworn in, according to data from U.S. Customs and Border Protection.
That’s how we’ve been calculating this statistic going back to our “Numbers” articles for President Barack Obama.
But that snapshot undersells the surge in illegal immigration during Biden’s four years in office, because apprehensions dropped dramatically in the second half of 2024 after Biden initiated some emergency policies to curb illegal border crossings.
Before then, the U.S. was experiencing historically high illegal immigration.
Border Patrol agents encountered more than 7 million people (7,383,107) attempting to cross the border illegally over Biden’s four years in office, though some were repeat offenders. Recidivism rates — meaning those caught trying to illegally cross the border more than once — climbed to 27% in fiscal year 2021. Nonetheless, that number of encounters of immigrants attempting to illegally cross the border was nearly 265% higher than during the four previous years under Trump (2,025,350).
Six months after illegal immigration encounters reached a monthly peak of 249,740 in December 2023, Biden announced a series of executive actions designed to address “substantial levels of migration” due to “global conditions” — including “failing regimes and dire economic conditions,” “violence linked to transnational criminal organizations,” and “natural disasters” in some countries in Central and South America. Specifically, the proclamation directed border officials to temporarily restrict asylum eligibility and promptly remove many who crossed the border illegally between ports of entry when the daily average of encounters reached 2,500 or more for seven straight days.
The policy was immediately implemented on June 5 because levels were already well above that. (For more on the policy, see our story “Q&A on Biden’s Border Order.”) Apprehensions of illegal border crossers dropped dramatically after that, averaging about a third as many compared with the six months before the emergency changes.
In addition, apprehensions tell only part of the immigration story during the Biden administration, as there was also a surge in immigrants who came to the U.S. via newly created legal means, such as those granted parole, a legal permission granted to noncitizens to temporarily live in the U.S. for “urgent humanitarian or significant public benefit reasons.” Biden extended parole to immigrants from countries such as Cuba, Haiti, Nicaragua and Venezuela.
According to congressional testimony from Steven A. Camarota, director of research at the Center for Immigration Studies, an organization that favors low immigration, about 2.8 million people were granted parole during the Biden administration.
In addition to those seeking parole, the number seeking asylum also remained high. In January 2023, in order to facilitate a safer and more orderly process, the Biden administration began accepting CBP One mobile app applications that allowed immigrants to set up appointments to request asylum or parole and be screened for entry to the U.S. So while the number of illegal crossings went down, the number of immigrants coming to ports of entry hovered around 50,000 per month for over a year. In the last nine months during Trump’s first term, those kinds of encounters were under 3,000 a month.
“The unauthorized immigrant population has seen periods of sharp growth before – particularly in the late 1990s and early 2000s,” Julia Gelatt, associate director of the U.S. immigration policy program at the Migration Policy Institute, told us via email. “In contrast to that earlier period, over the past three years, many people came in with permission—either through the CBP One application process or through the parole program for Cubans, Haitian, Nicaraguans, and Venezuelans. And many people who snuck across the border between ports of entry applied for asylum.”
“There were many different drivers in the growth of the unauthorized immigrant population during the Biden presidency: strong labor demand in the U.S. as the country rebounded from the COVID-19 recession, and push factors such as authoritarian governments in Cuba, Nicaragua, and Venezuela and intense gang violence and extortion in countries like Haiti and Ecuador,” Gelatt said. “It’s also possible that some people moved in order to take advantage of new pathways created by the Biden administration.”
Refugees
The number of refugees admitted to the U.S. dramatically increased during the Biden administration, compared with the previous four years of Trump’s presidency. But Biden never did fulfill his ambitious campaign promise to accept up to 125,000 refugees a year.
Overall, the U.S. admitted 222,829 refugees in Biden’s full 47 months in office, or an average 4,741 refugees per month, the State Department’s data show. That’s 157% higher than the 1,845 monthly average under Trump, who drastically reduced the admission of refugees. The Trump administration admitted only 86,731 refugees in four years. (For both presidents, our monthly averages include only full months in office, excluding the months of January 2017 and January 2021, when administrations overlapped.)
The Biden administration set the cap on refugee admissions for fiscal years 2022, 2023, 2024 and 2025 at 125,000. While the administration never hit that target, the numbers grew each year Biden was in office. The administration admitted 25,465 refugees in FY 2022 and 60,014 in FY 2023. That number jumped to 100,034 in FY 2024, according to State Department data. Biden only served for three full months into FY 2025.
In its annual report to Congress on the state of the refugee program near the end of Biden’s term, the State Department said: “Over the past three years, the Biden-Harris Administration has restored, strengthened, and modernized the USRAP [U.S. Refugee Admissions Program]. This included a whole-of-government effort to streamline and improve overseas refugee processing, enhance the security and integrity of the program, digitize case management for efficiency, work through the backlog of the oldest cases, increase staffing to support operations, and reestablish and expand the domestic infrastructure for welcoming refugees.”
“These efforts have resulted in steady annual increases in refugee admissions, with admissions doubling in FY 2022 and again in FY 2023,” the report stated. “In FY 2024, the United States expects to reach a historic milestone by resettling 100,000 refugees from around the world – the most in three decades. USRAP is on its strongest footing in modern history.” As we said, the administration did just barely cross that 100,000 threshold for FY 2024.
Upon taking office in January 2025, Trump immediately and indefinitely suspended the U.S. Refugee Admissions Program.
Trade
After a decline in 2023, the first since 2019, the international trade deficit in goods and services increased to $903.5 billion in 2024, according to the Bureau of Economic Analysis. That was lower than the record $923.7 billion deficit in 2022, but still about 39.9% higher than the $646 billion deficit in 2020.
Annual exports of U.S. goods and services increased about 48.8% in 2024 compared with 2020, while annual imports of goods and services went up by about 46.7% in 2024 compared with four years earlier. The trade gap increased three out of four years during Biden’s presidency.
Notably, the U.S. trade deficit in goods and services with China decreased by almost $20.4 billion under Biden. Meanwhile, the trade deficit with Mexico increased by about $65.3 billion, and the trade surplus of almost $2 billion with Canada in 2020 turned into a deficit of $36 billion in 2024.
Home Prices & Homeownership
Home prices — The national median price of an existing, single-family home was $412,500 in 2024, according to seasonally adjusted annual sales figures from the National Association of Realtors. That was 37.4% higher than it was in 2020, when the median price was $300,200.
Experts say the rise in home prices was due largely to a shortage in available housing, which began before Biden was president.
Homeownership — The homeownership rate — the percentage of “occupied housing units that are owner-occupied,” according to the Census Bureau — fluctuated slightly during the Biden years.
The rate was 65.8 in the fourth quarter of 2020, before Biden took office, and was 65.7 in the fourth quarter of 2024, a decline of 0.1 percentage points. The homeownership rate peaked at 66 during the third quarter of 2022 and the first and third quarters of 2023.
Data from the second quarter of 2020 through the third quarter of 2021 “should be viewed with caution” because restrictions during the pandemic “prevented normal data collection,” the U.S. Department of Housing and Urban Development’s Office of Policy Development and Research says on its website. HUD’s policy and research arm explains that these “changes in survey methods,” including the suspension of in-person surveys in the second quarter of 2020, “likely contributed to wide swings in the data.”
The highest homeownership rate on record was 69.2% in the last quarter of 2004, during George W. Bush’s presidency.
Food Stamps
The number of individuals receiving benefits from the Supplemental Nutrition Assistance Program increased only slightly under Biden.
When he left office in January, there were almost 42.4 million people enrolled in SNAP, formerly known as food stamps, according to data from the Department of Agriculture. That was up from more than 42.1 million people participating in Biden’s inauguration month in 2021. The four-year increase was about 0.6%, or, more specifically, 255,368 people.
The increase under Biden was a reversal from the modest decrease of about 590,000 participants during Trump’s first term. The highest monthly enrollment during the Biden administration was nearly 42.8 million individuals in January 2023, and the lowest enrollment was fewer than 40.8 million people in August 2021.
Income and Poverty
Household income — Household income rose again last year and was up overall under Biden.
The real median household income was $83,730 in 2024, according to Census Bureau estimates. When factoring in inflation, that was an increase of $2,150, or roughly 2.6%, from 2020, when the pandemic contributed to a decline in incomes.
(The median figure represents the midpoint — half of all households earned more, half less.)
The increase in 2024 was the second straight year that incomes went up after three annual decreases for households, starting in 2020. The 2024 estimate was also $470 above the pre-pandemic record high in 2019.
Poverty — As incomes increased, the official poverty rate, which is based on an individual’s or family’s pretax cash income, declined for the third straight year under Biden. The poverty rate of 10.6% was down 0.5 percentage points from 2023 and down 0.9 percentage points from 2020, according to the Census Bureau’s estimates.
In raw numbers, there were about 35.9 million people below the poverty line in 2024 compared with almost 36.6 million in 2020.
However, by the Census Bureau’s alternative estimate, the Supplemental Poverty Measure, poverty increased under Biden.
Unlike the official poverty rate, the SPM, which was introduced in 2011, factors in government programs that benefit low-income families and individuals, such as food, housing and energy assistance, as well as tax credits and stimulus payments. The SPM also considers other necessary expenses, such as medical costs, and regional differences in the cost of living.
The supplemental poverty rate was 12.9% in 2024, the same as it was in 2023. But the rate was up from 12.4% in 2022, 7.8% in 2021 and 9.2% in 2020. The supplemental rate was 11.8% in 2019, before the pandemic. The bump in poverty based on the SPM started in 2022, after stimulus payments and tax credits enacted during the pandemic were no longer available.
Debt and Deficits
The federal debt held by the public increased by one-third on Biden’s watch, spurred on by four consecutive years of budget deficits.
Debt — According to the Treasury Department, the amount of federal borrowing held by the public, which excludes money the government owes itself, went up by 33.3% during the Biden administration — going from more than $21.6 trillion to more than $28.8 trillion.
Despite an increase in the debt amount, debt as a percentage of gross domestic product decreased under Biden. It fell from 98.6% of GDP in fiscal year 2020 to 97.8% of GDP in fiscal year 2024, according to Office of Management and Budget figures.
Deficits – Annual deficits declined for the first half of Biden’s presidency, after emergency spending during the pandemic helped run the budget gap to a record $3.1 trillion in fiscal year 2020. Biden frequently took more credit than deserved for the fiscal year 2022 deficit coming in at about $1.4 trillion, which had more to do with the expiration of that pandemic-related spending than Biden’s policies.
After that, budget deficits increased to $1.7 trillion in fiscal year 2023 and to more than $1.8 trillion in fiscal year 2024. Both totals were higher than deficits in any pre-pandemic year.
Oil Production and Imports
Contrary to Republican claims that Biden was hampering domestic energy output, crude oil production accelerated to new highs during his presidency.
There were more than 13.2 million barrels of crude oil produced on average per day in 2024 – about 16.8% higher than the average of 11.3 million barrels per day in 2020, according to the Energy Information Administration. The 2024 average eclipsed the previous production record of more than 12.9 million barrels on average per day in 2023. Those production increases led to record exports of crude oil in 2023 and 2024 as well.
Crude oil, natural gas, natural gas plant liquids, biofuels, solar and wind all set domestic production records last year, the EIA said.
On the other hand, crude oil imports also increased under Biden, going up about 12.1% from an average of almost 5.9 million barrels imported per day in 2020 to almost 6.6 million barrels per day in 2024. Annual crude oil imports increased each year under Biden, but were still lower than they were in the most recent years preceding the pandemic.
Carbon Emissions
Meanwhile, carbon dioxide emissions from energy consumption declined a bit year over year in 2024 – to the lowest level in about 40 years save for a pandemic-induced low in 2020.
Last year, there were nearly 4.8 billion metric tons of CO2 emissions from the consumption of coal, natural gas and petroleum products in the U.S. That was about 4.5% more than the nearly 4.6 billion metric tons of CO2 emitted from those sources in 2020.
Emissions have generally been on the decline since the late-2000s, according to EIA data. Outside of 2020, which had lower than usual emissions due to the pandemic, 2024 saw the lowest total emissions since 4.77 billion metric tons were emitted in 1987.
Gun Sales
Estimates indicate annual gun sales declined each year during the Biden presidency. While sales dropped significantly from a pandemic peak in 2020, sales remained higher than pre-pandemic.
The government doesn’t collect data on gun sales. But the National Shooting Sports Foundation — the gun industry’s trade group — estimates gun sales by tracking the number of background checks for firearm sales based on the FBI’s National Instant Criminal Background Check System. The NSSF-adjusted figures exclude background checks unrelated to sales, such as those required for concealed-carry permits.
In Biden’s final year, the NSSF-adjusted figure for the sales of firearms was more than 15.2 million. That was down more than 27.7% from the record of nearly 21.1 million in 2020, when sales spiked during the first year of the pandemic. But it’s still higher than the 13.2 million guns sold in 2019.
Judiciary Appointments
In his one term, Biden filled the Supreme Court seat vacated by Justice Stephen Breyer, and he added dozens of District Court and Court of Appeals judges.
Supreme Court — Biden finished his term having appointed only one justice to the Supreme Court, Justice Ketanji Brown Jackson, who replaced a retiring Breyer and was confirmed by the Senate on April 7, 2022. Biden is the first president since Gerald Ford to fill just one seat on the high court during his presidency. Trump appointed three Supreme Court justices during his first term.
Court of Appeals — Biden had 45 of his nominees confirmed to the U.S. Court of Appeals, according to records from the Administrative Office of the U.S. Courts. The majority, 28 appointments, were during his first two years, and the other 17 confirmations happened in his last two years in office. Biden’s total is short of the 54 judges Trump appointed to the Court of Appeals during his first term.
District Court – Biden also won confirmation for 188 judges he nominated to be federal District Court judges. (Our count includes confirmation for the reappointment of the chief judge of the District Court for the Northern Mariana Islands.) That is about 27.8% of the 677 authorized district judges. Biden had more District Court judges confirmed than Trump, who had 175 confirmed during his first term.
In addition, five U.S. Court of Federal Claims judges were confirmed under Biden – fewer than the 10 seats filled during Trump’s first four years. And the three seats filled on the Court for International Trade under Trump were more than the two seats under Biden.
Sources
We provide links to the sources for these statistics throughout the article.
Editor’s note: FactCheck.org does not accept advertising. We rely on grants and individual donations from people like you. Please consider a donation. Credit card donations may be made through our “Donate” page. If you prefer to give by check, send to: FactCheck.org, Annenberg Public Policy Center, P.O. Box 58100, Philadelphia, PA 19102.